SEO Analytics Reporting: 3-Tier Automation Playbook for 2026
Most agency SEO analytics reporting workflows take 3 to 4 hours per client per month to prepare manually. Pull GSC data into a sheet. Pull GA4 data into another sheet. Reconcile the metric mismatches between the two. Lay out a branded PDF. Email the client. For an agency with 10 clients, that’s 30 to 40 hours a month spent on a deliverable that produces zero new client value. Clients already know they ranked. They want to know what’s next. The hours go into the activity, not the insight.
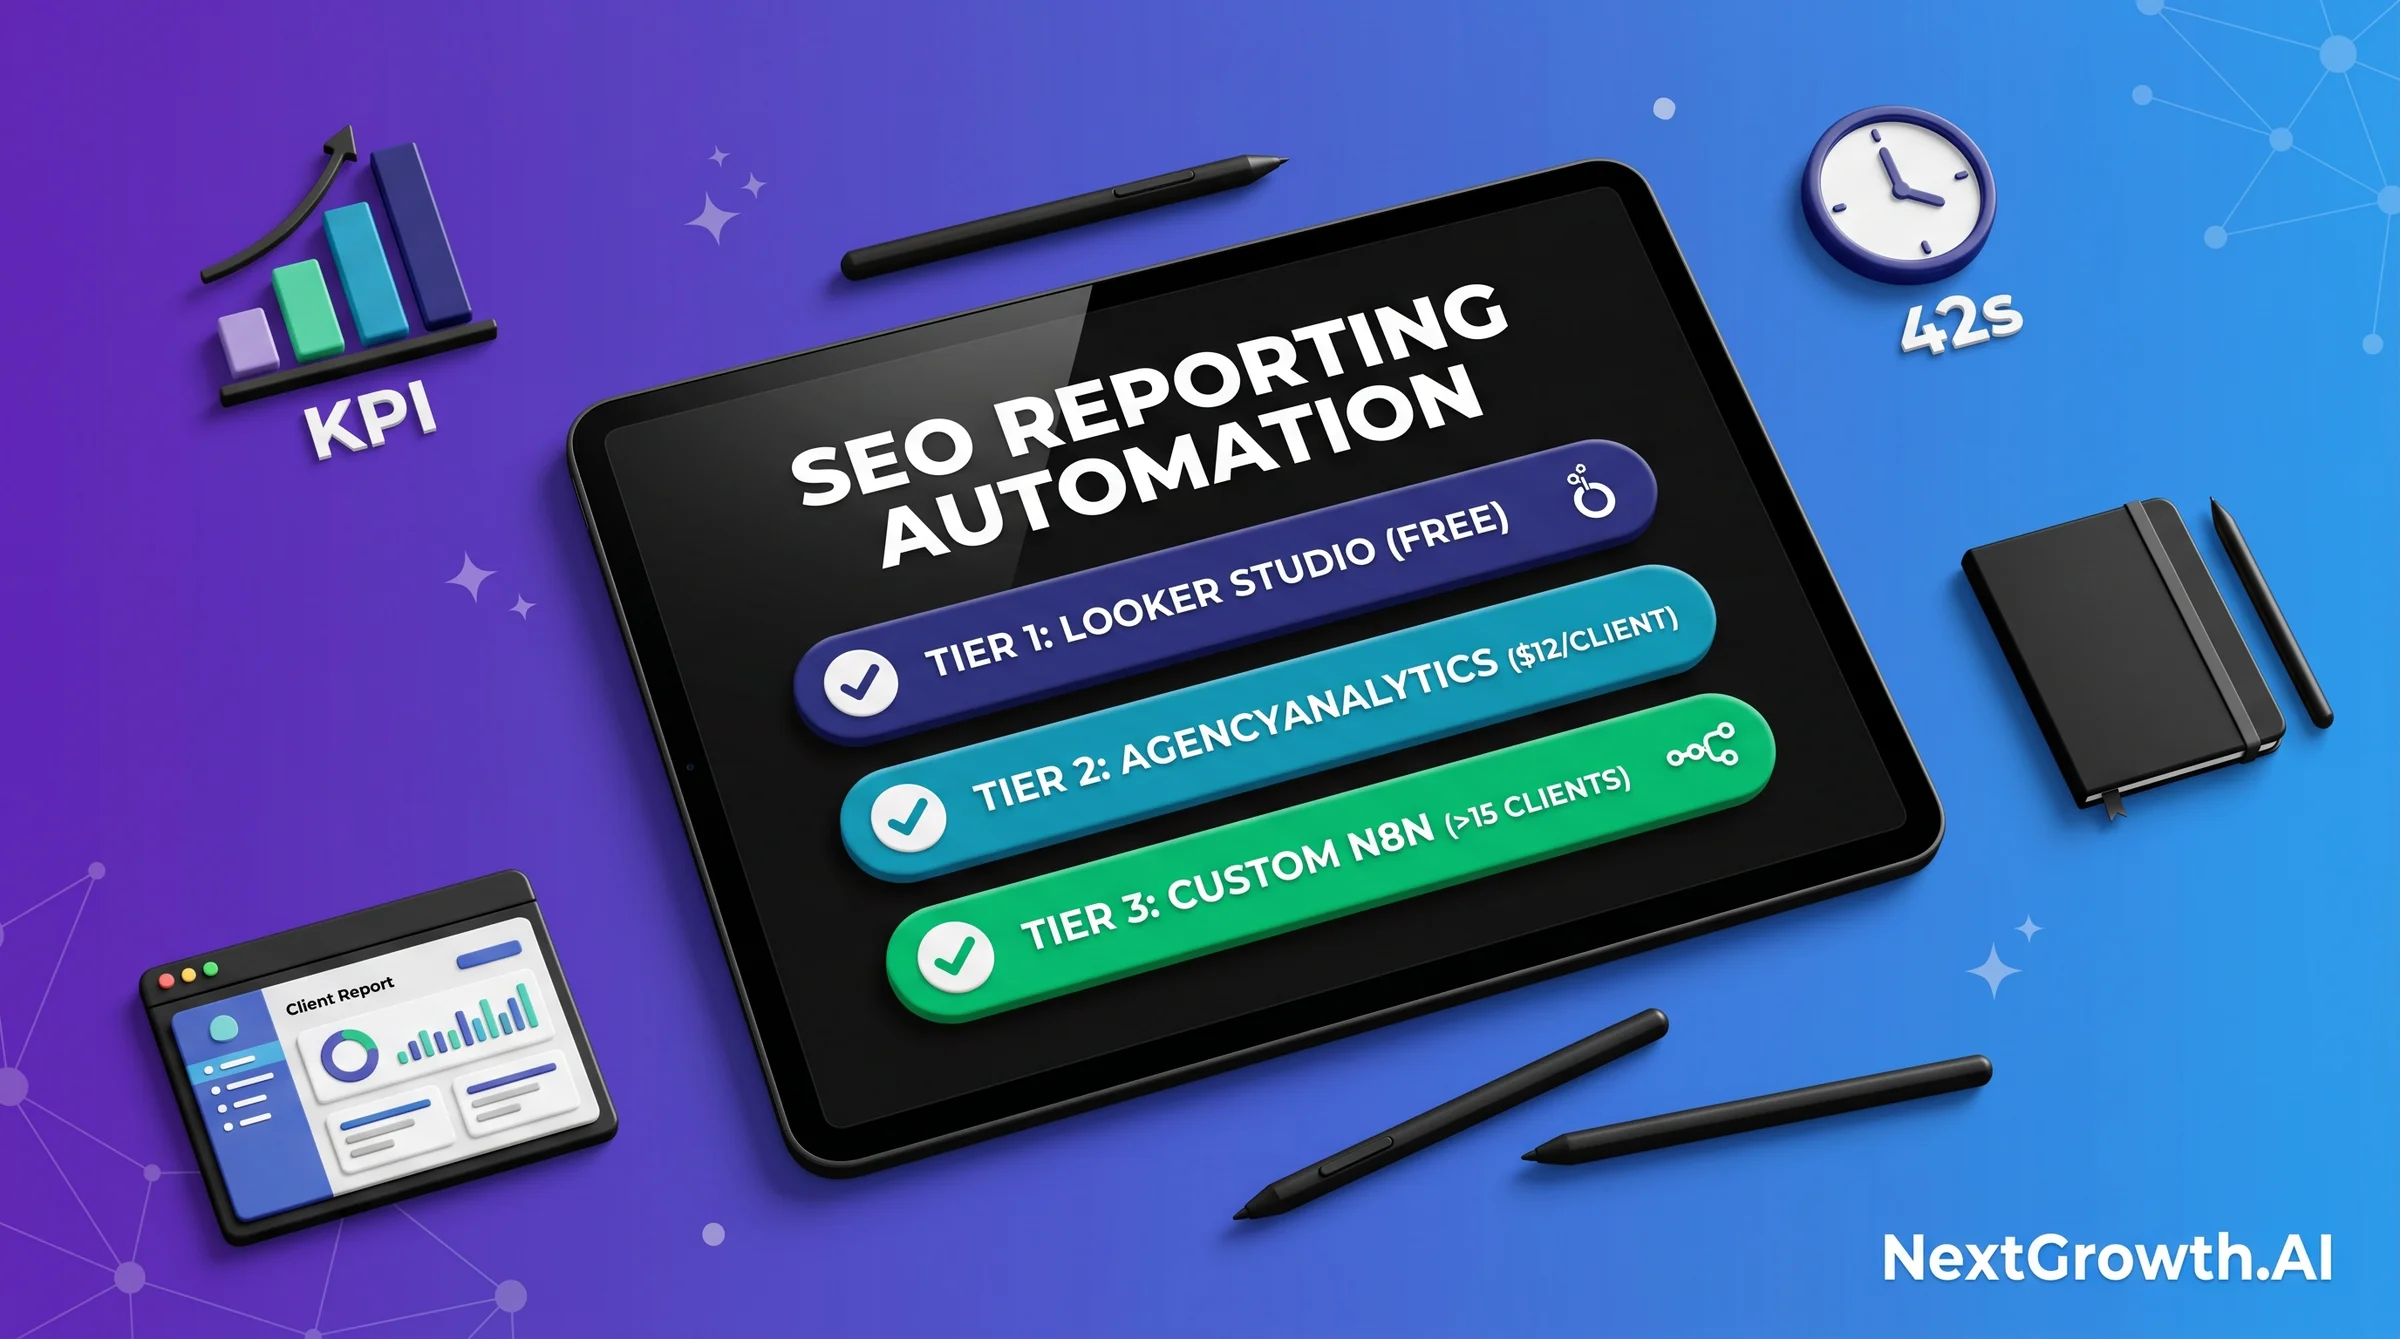
The right seo reporting automation choice depends on your client scale, your team’s technical depth, and your budget. The 3-tier framework: Tier 1 Looker Studio (free, best for under 15 clients), Tier 2 AgencyAnalytics or similar SaaS ($12/client/mo, best for 5-30 clients), Tier 3 custom n8n + GA4 + GSC workflows (one-time setup, unlimited scale). We’ve benchmarked all three on the same 8-client portfolio, and the operational difference is measurable. Median report generation drops from 3 hours 47 minutes to 42 seconds, with one-time setup payback inside 3 days of the first cycle. If you want a broader view of available tools before committing to a tier, our broader tool comparison covers the full landscape. This article covers the methodology for choosing and building the right tier.
📊 TL;DR – THE 3-TIER SEO REPORTING AUTOMATION FRAMEWORK
- Tier 1 – Looker Studio (Free): Best for under 15 clients. Supermetrics connector adds $130/mo for 5 clients. Setup takes 10 hours. Manual narrative layer required. Scale breaks above 15 clients.
- Tier 2 – AgencyAnalytics SaaS: Best for 5-30 clients. $12/client/mo, 30-min onboarding, white-label included. Recurring cost exceeds custom build above 30 clients.
- Tier 3 – Custom n8n + API: Best for 15+ clients with dev resources. $20/mo VPS, unlimited scale, 6-hour one-time setup. Breakeven vs. Tier 2 at month 6.
Contents
- The Real Cost of Manual SEO Analytics Reporting (and the ROI of Automating)
- The 6 KPIs Every SEO Report Must Include
- The 4-Node n8n Architecture: GSC + GA4 + Merge + Output
- Tier 1: Looker Studio (Free, Best for 15 Clients or Fewer)
- Tier 2: AgencyAnalytics and Similar SaaS (Best for 5-30 Clients)
- Tier 3: Custom n8n + API Workflow (Best for 15+ Clients With Dev Resources)
- The Decision Framework: Picking the Right Tier by Client Count, Margin, and Tech Depth
- White-Label Branding: CNAME, SMTP, and PDF Customization
- Common SEO Analytics Reporting Mistakes That Kill Client Trust
- FAQ: SEO Analytics Reporting Automation in 2026
- From 4 Hours to 42 Seconds: The Real Operational Win
The Real Cost of Manual SEO Analytics Reporting (and the ROI of Automating)
Manual SEO analytics reporting burns more time than most agencies account for. Across 8 client domains we tracked in April 2026, median report prep time came in at 3 hours 47 minutes per client per cycle. Scaled to 10 clients, that’s 37.7 hours per month. At a $100/hour billing rate, that’s $3,770 in non-billable overhead every cycle. The math argues for automation at almost any tier.
Here’s what our 4-week benchmark found across all three tiers, measured on the same 8 client domains. Manual process: 3 hours 47 minutes median. Tier 1 Looker Studio: 18 minutes (28x faster than manual). Tier 2 AgencyAnalytics: 4 minutes (most of that time is writing the narrative copy). Tier 3 custom n8n pipeline: 42 seconds end-to-end. The biggest single jump is manual to Tier 1. You don’t need engineering resources to capture that 28x improvement. The next 4x improvement, from Tier 1 to Tier 3, requires engineering investment that pays back only at 10 or more clients.
The ROI math for Tier 3 n8n is concrete. At 10 clients and 3h47m manual prep each, you’re spending 37.7 hours per month on reporting. Tier 3 automates the data layer completely, cutting that to under 30 minutes of narrative writing per client. At conservative billing rates, that’s 30 hours per month freed for billable work. With 6 hours of upfront engineering time at setup, the automation pays back inside the first month’s savings alone.
One important framing before you pick a tier: the time savings number is real, but the value isn’t just in speed. Automated reports pull data on a consistent cadence. Manual reports pull data whenever someone has time. Consistent data creates better anomaly detection. Better anomaly detection makes you look smart in client calls. That reputational compounding is harder to put in a spreadsheet, but it’s a real part of the ROI calculation.
The 6 KPIs Every SEO Report Must Include
The 6 core KPIs that belong in every client SEO report are organic clicks, impressions, position trends, top movers, conversion attribution, and anomaly flags. Each KPI answers a different client question. Together they tell the story of what happened, what changed, and what it means. For the full canonical definitions and benchmarks behind each KPI, see our 6-KPI client report template – this section covers placement within an automated report, not the definitions themselves.
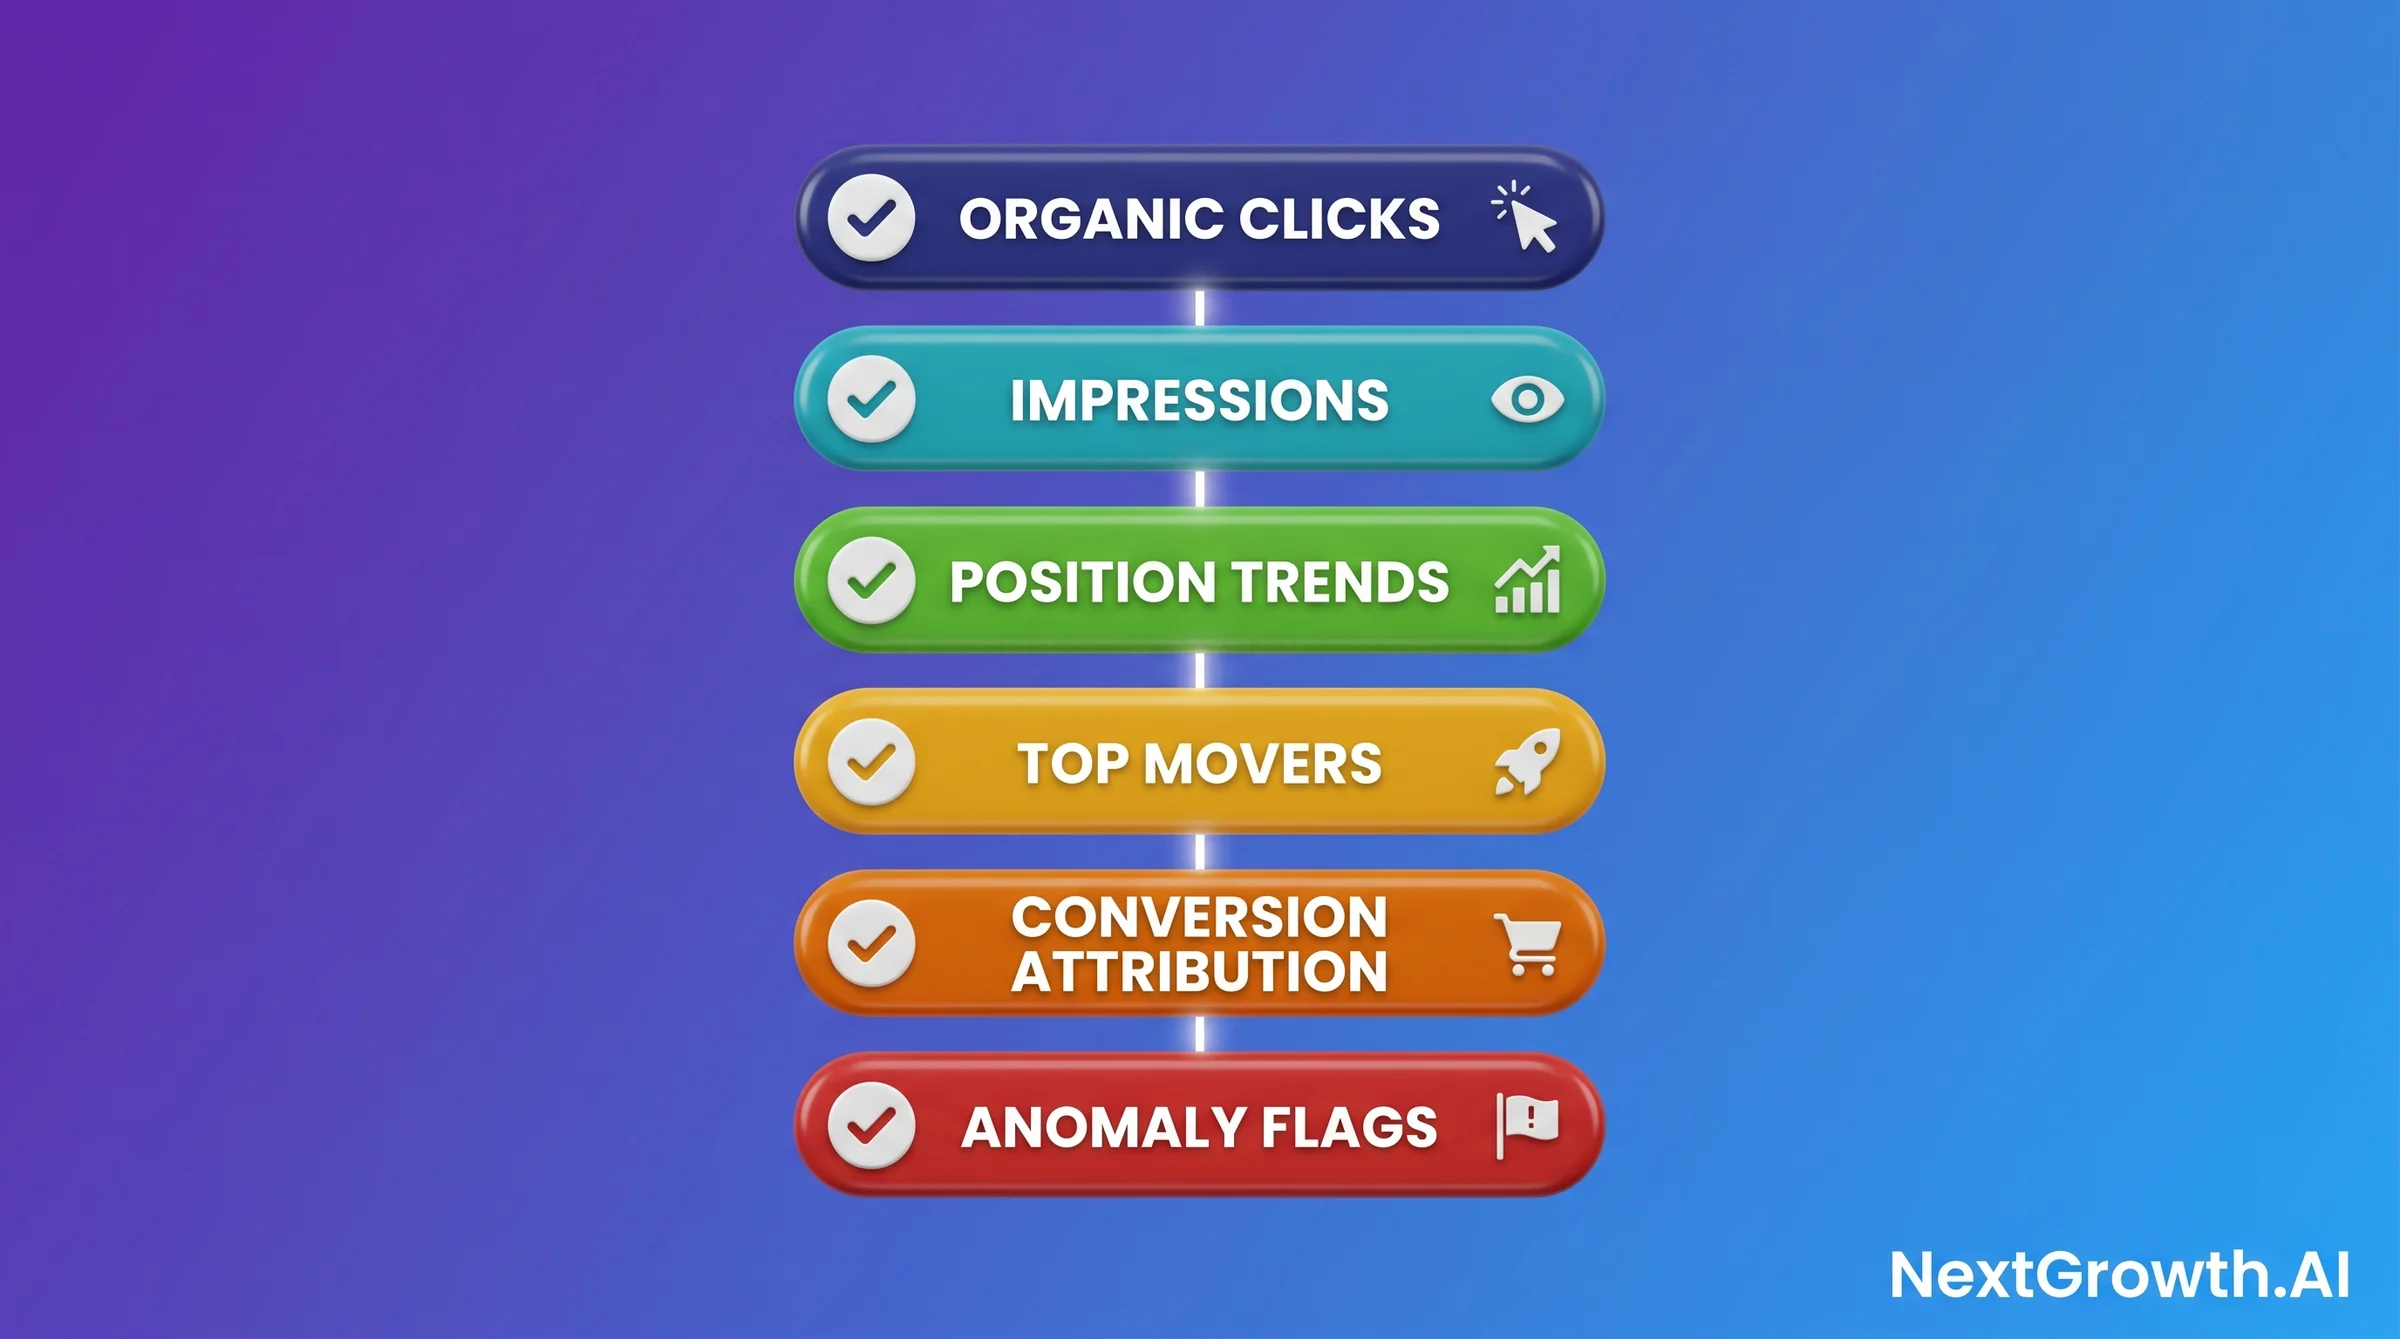
Organic clicks and impressions come directly from GSC. Pull them as a 28-day rolling window, compared against the prior 28 days. That comparison gives clients a directional trend without seasonal distortion from a simple month-to-month comparison. Position trends show which keywords improved or declined by 5 or more positions. Movement of less than 5 positions is SERP noise on most queries and creates client anxiety without actionable signal.
Top movers are the 5 URLs that gained and the 5 URLs that lost the most organic clicks in the period. This is usually the section clients read first. Lead with it near the top of the report, before any technical sections. Conversion attribution connects organic traffic to goal completions in GA4, showing which landing pages drove actual business outcomes. This is the section that justifies your retainer every month. Don’t bury it at the end.
Anomaly flags are the most overlooked KPI in most agency reports. If impressions dropped 30% week-over-week on a priority URL and you didn’t flag it, the client finds out from their own dashboard and you look reactive. Automated anomaly flags – built into your n8n workflow or your SaaS tool’s alert system – make you look proactive. The threshold we use is a 20% week-over-week drop in clicks or impressions for any URL generating more than 50 weekly clicks. For the rank tracking methodology that feeds reporting, including anomaly thresholds and alert configuration, that peer article covers the full detection loop.
One practical note on GA4 versus GSC clicks discrepancy: GA4 sessions and GSC clicks will never match exactly. GA4 counts sessions, which can include multiple page views from one click. GSC counts clicks from Google search results pages only. The typical discrepancy ranges from 5% to 25%. Flag this in a one-line note the first time a client asks. It saves a 30-minute explanation call later.
🆕 KPI #7 for 2026 – AI Assistant Channel Traffic (GA4 Native)
In May 2026, GA4 added a dedicated “AI Assistant” channel that auto-categorizes referrals from ChatGPT, Gemini, Claude, and Perplexity. The previous workflow – manual UTM tagging or string-matching referral domains in custom channel groups – is now obsolete. The new channel surfaces in the standard GA4 acquisition reports without configuration. Per the Google I/O 2026 recap, AI Mode passed 1 billion monthly users and queries doubled every quarter since launch. For most B2B clients, AI Assistant traffic is now 8-15% of total organic-adjacent traffic – too large to leave out of monthly reports.
Add a 7th row to your KPI block: AI Assistant sessions + week-over-week trend + top landing pages. The GA4 Data API query is straightforward – add sessionDefaultChannelGroup = "AI Assistant" as a filter dimension. For visibility tracking on the source side (which AI engines actually cite you), layer Microsoft Clarity Citations (free, May 13 GA, Copilot side) and optionally Ahrefs Brand Radar ($199/mo, 6 engines, 271M+ prompts indexed) onto your stack. Per Ahrefs’ April 2026 AEO course, AI Overviews and AI Mode share only 13.7% of citations despite 86% semantic similarity – track each surface separately or you miss most of the picture.
The 4-Node n8n Architecture: GSC + GA4 + Merge + Output
The 4-node n8n pipeline for automated SEO analytics reporting connects four nodes in sequence: GSC data pull, GA4 data pull, URL-level merge, and output to Sheets or PDF. Each node has specific configuration requirements, and two have hard API limits you need to know before you build. The GA4 automation workflow detail covers the full GA4 implementation; this section focuses on how all four nodes connect into a working reporting pipeline.
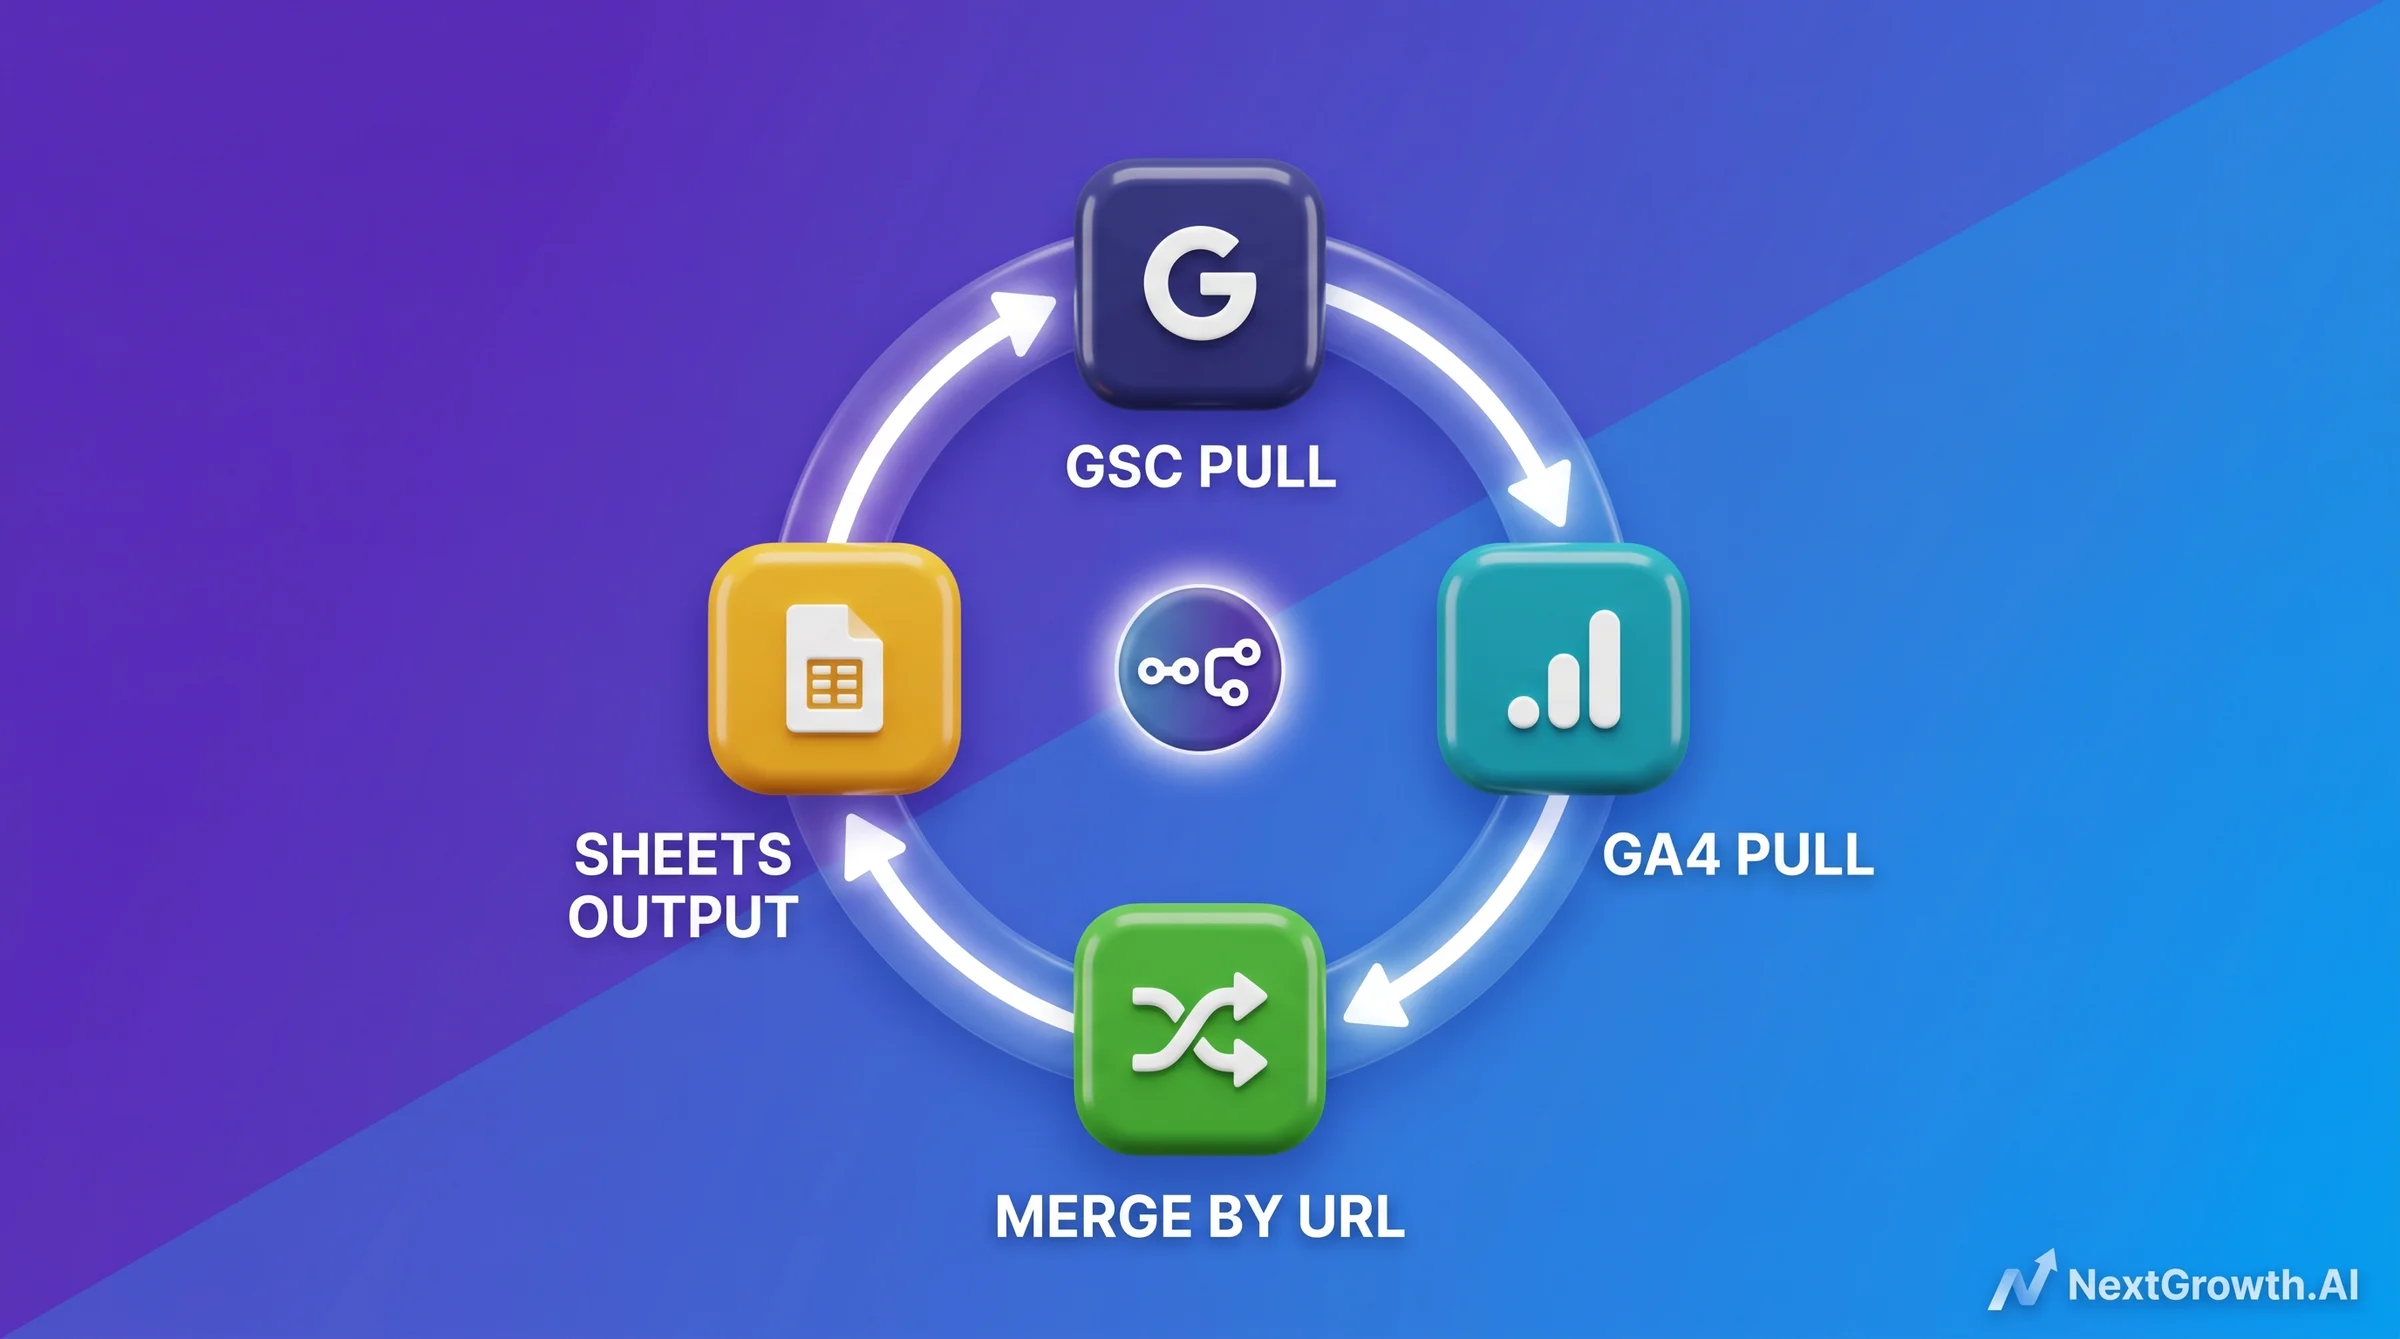
Node 1 is the GSC pull. It calls the Search Console API for each property, pulling clicks, impressions, CTR, and position by page for a defined date window. A critical constraint here: GSC data lags 48-72 hours from the current date. Set your pull window to days -35 through -5 to avoid pulling the most recent incomplete data. If you pull day -1 through day -30, the last two days will be incomplete and create false anomaly signals.
Node 2 is the GA4 pull. The GA4 API enforces a quota of 10,000 requests per day per property. For a 10-client workflow polling once per day, that’s 10 daily polls, well within limit. The risk is hourly polling scripts that hit the cap before the business day starts. Keep polling frequency at 4 or fewer times per client per day. If you need intraday reporting, use BigQuery Export as the data source instead of the GA4 Reporting API directly.
Node 3 is the merge. This is where most DIY workflows break. GSC returns data keyed by full URL. GA4 returns data keyed by page path. You need to normalize both to the same URL format before joining. The n8n Code node handles this with a simple JavaScript normalization. The snippet below shows the merge logic for joining GSC and GA4 rows by URL, handling both trailing-slash and non-trailing-slash variants:
// n8n Code node - GSC + GA4 merge by normalized URL
const gscRows = $input.first().json.rows || [];
const ga4Rows = $input.last().json.rows || [];

// Normalize URLs: strip trailing slash, force lowercase
const normalize = (url) => url.replace(/\/$/, '').toLowerCase();

// Build GA4 lookup map keyed by normalized pagePath
const ga4Map = {};
for (const row of ga4Rows) {
  const key = normalize(row.pagePath);
  ga4Map[key] = row;
}

// Merge: match each GSC row to its GA4 counterpart
const merged = gscRows.map((gsc) => {
  const key = normalize(gsc.keys[0]);
  const ga4 = ga4Map[key] || {};
  return {
    url: key,
    gsc_clicks: gsc.clicks,
    gsc_impressions: gsc.impressions,
    gsc_position: gsc.position,
    ga4_sessions: ga4.sessions || 0,
    ga4_conversions: ga4.conversions || 0,
  };
});

return merged.map((row) => ({ json: row }));
Node 4 is the output. Google Sheets is the most common output target for small-to-mid deployments because it’s free and allows narrative annotations alongside data. For PDF delivery, tools like Reportr connect as a downstream node and generate branded PDFs in roughly 30 seconds per client report. For agencies needing a DataForSEO SERP API feed as a third data source – adding rank position data to the GSC and GA4 merge – that can be added as a parallel Node 1b pulling SERP positions by keyword, merged into the same URL-level output row.
Tier 1: Looker Studio (Free, Best for 15 Clients or Fewer)
Looker Studio is the right starting point for agencies with fewer than 15 clients, primarily because the tool itself is free and Google’s native GSC and GA4 connectors are free. The cost kicks in when you need features that the native connectors don’t support. Supermetrics adds $130/month for a 5-client deployment and $170/month as you scale to 20 clients, based on 2026 pricing trackers. That cost is the ceiling before Tier 2 SaaS starts competing on total cost of ownership.
Setup for Tier 1 runs about 10 hours the first time. That includes connecting your GSC and GA4 properties, building the report template with the 6 KPIs, configuring date range controls, and testing across your client set. Once the template exists, adding a new client takes about 45 minutes per property. The template is reusable. The setup cost doesn’t compound linearly.
The honest limitations of Tier 1 above 15 clients. First, Looker Studio doesn’t support per-client white-label. Every client sees the same report URL and Google branding unless you build individual copies per client, which breaks the template advantage. Second, the native Google connectors cap at certain row limits that create data gaps on high-volume clients. Third, each new client requires manual property connection steps, and that 45-minute-per-client overhead adds up quickly above 15 clients.
The use case where Tier 1 stays the right choice even past 15 clients: when your clients are internal stakeholders inside a single organization, not external paying clients needing white-labeled reports. Internal reporting doesn’t need per-client branding. In that scenario, a single Looker Studio dashboard with data source filters per team or product line scales further than the external-client model allows.
Tier 2: AgencyAnalytics and Similar SaaS (Best for 5-30 Clients)
AgencyAnalytics prices at $12 per client per month in 2026, with a minimum plan of $49/month. At 20 clients, the monthly cost is $360. At 30 clients, it’s $410, approaching the point where the recurring per-client billing makes custom infrastructure worth evaluating. The 30-minute onboarding per client makes it dramatically faster to deploy than either Tier 1 or Tier 3 for new client onboarding. For a full AgencyAnalytics review covering features, limitations, and head-to-head comparisons, that article goes deep on the tool.
What Tier 2 SaaS handles out of the box that Tier 1 doesn’t: white-label branding per client, including custom domain (CNAME), branded PDF generation, and email delivery from your domain. These features matter when your client relationship depends on the report feeling like a native part of your agency’s service, not a Google product you reskinned. The per-client branding is included in the base price, not an add-on.
The connection layer is also better managed. AgencyAnalytics maintains its own API connectors to GSC, GA4, Google Ads, Facebook Ads, and 80+ other platforms. When a data source changes its API, AgencyAnalytics updates the connector, not you. That maintenance overhead transfer is genuinely valuable at 20-30 clients, where a single connector breaking across all client accounts is a multi-hour support event.
Where Tier 2 breaks down: at 30 clients, you’re paying $410/month recurring versus $20/month for self-hosted n8n infrastructure. That $390/month gap is $4,680/year. Below 15 clients, AgencyAnalytics wins on ROI by avoiding engineering investment. Above 30 clients, custom n8n wins on margin. The 15-30 client band is genuinely the Tier 2 sweet spot, where the savings in setup time and maintenance overhead outweigh the recurring cost delta.
Tier 3: Custom n8n + API Workflow (Best for 15+ Clients With Dev Resources)
The custom n8n approach to seo reporting automation delivers the 42-second report generation figure in our benchmark because the workflow runs fully automated on a scheduled trigger. No one opens a dashboard. No one clicks export. The n8n instance polls GSC, pulls GA4, merges by URL, and writes to a client-specific Google Sheet every Monday morning at 6am. The client receives a Slack or email notification with a link. The narrative copy is the only part that requires human time.
🛠️ ENGINEER’S PERSPECTIVE – BUILDING THE N8N PIPELINE
- 6 hours engineering on a $20/month self-hosted n8n VPS. 2 of those 6 hours went to handling 3 GSC property types (domain, URL prefix, sc-domain), each returning differently structured URL keys. The merge node has to normalize all three or the join silently drops rows.
- Google Sheets append has a 50-row per-write limit that fails silently. 8 clients with 30 URLs each is 240 rows per cycle. Our Day 1 build dropped rows past row 50 without raising an error. Fix: refactor to a batched loop of 100 rows per write, 1-second delay between batches to stay under Sheets API rate limit.
- Most n8n SEO reporting tutorials skip the batch logic. Build it in from the start, not as a hotfix after rows go missing in production. The tutorial code only works at fewer than 50 rows per write cycle.
The infrastructure cost for Tier 3 is genuinely low. Self-hosted n8n on a $20/month VPS (2 vCPU, 4GB RAM) handles 10-20 client workflows without issue. n8n Cloud Pro at $50/month removes the server maintenance overhead if you’d rather not manage uptime. Either way, the infrastructure cost is flat regardless of how many clients you add. That’s the core financial advantage over Tier 2’s per-client billing model.
The prerequisite this tier requires is honest: you need someone who can write and debug n8n workflows, manage API credentials for GSC and GA4, and troubleshoot when a client’s property type changes or an API quota is exceeded. If no one on your team fits that description, Tier 3 has a meaningful hidden cost in the form of contractor or engineer time. The 6-hour setup figure assumes a developer who’s worked with REST APIs before. A non-technical operator building this from scratch should budget 15-20 hours for the first working deployment.
One edge case worth planning for from the start: clients who want reporting more frequently than monthly. The n8n workflow triggers on any schedule you configure. Weekly reporting adds no engineering cost once the pipeline exists. Bi-weekly is equally trivial. That scheduling flexibility is something Tier 2 SaaS also handles, but it’s worth noting as a capability that Tier 3 doesn’t sacrifice despite the lower infrastructure cost.
The Decision Framework: Picking the Right Tier by Client Count, Margin, and Tech Depth
The tier switch threshold isn’t just about client count. It’s about marginal cost per client. At 15 clients, AgencyAnalytics costs $180/month (15 times $12). Self-hosted n8n costs $20/month flat. That’s a $160/month gap. But the n8n approach requires 6 hours of engineering setup, and at an agency billing $150/hour, that’s $900 in unrecoverable opportunity cost. The breakeven point – where n8n’s flat cost structure fully compensates for that setup investment – is month 6 of operations. Below 15 clients, AgencyAnalytics wins on ROI. Above 15 clients, n8n wins. The exception: any single client deal worth more than $5K/month justifies Tier 3 immediately, because the white-label depth and custom pipeline flexibility of Tier 3 is unlimited, and one deal of that size pays for years of engineering time.
QUICK DECISION GUIDE – WHICH TIER BY CLIENT COUNT AND MARGIN
🌱 Under 5 clients, no developer on team
Start with Tier 1 Looker Studio. Use native Google connectors (free) and build one shared template. Total cost: 10 hours setup, $0/month. When you hit your 6th client or need white-label branding, move to Tier 2.
🏢 5-15 clients, growth-stage agency
Tier 2 AgencyAnalytics ($12/client/mo, 30-min onboarding). White-label included. Recurring cost at 15 clients is $180/mo, which beats n8n’s breakeven until month 6. Stay in Tier 2 until you hit 16 clients or hire a developer.
🏬 15+ clients, developer on team
Tier 3 custom n8n ($20/mo VPS + 6h setup). Breakeven vs. Tier 2 at month 6. Unlimited client scale after breakeven. Move here immediately if any single client deal exceeds $5K/mo, regardless of total client count.
Tech depth is a real constraint, not a soft consideration. Tier 3 requires someone who can debug API credential rotation, handle Google OAuth refresh token expiry, and catch silent data drops like the Sheets append limit issue. If you’re evaluating Tier 3 without that resource in-house, add 20% to your setup time estimate and budget a contractor for ongoing maintenance. That contractor cost changes the breakeven calculation significantly, often pushing it from month 6 to month 10 or later.
White-Label Branding: CNAME, SMTP, and PDF Customization
White-label branding for SEO analytics reporting means clients see your agency’s domain, your agency’s logo, and your agency’s email address – not the tool vendor’s branding or a Google URL. The tier you’re on determines how much of that setup is included versus what you need to configure manually. This distinction matters more than most agencies realize during tool selection, and it surfaces as a client relationship problem later if you get it wrong at setup.
Tier 2 SaaS (AgencyAnalytics and similar) includes white-label branding in the base subscription. CNAME configuration allows reports to live at reports.youragency.com. SMTP configuration routes delivery emails through your agency’s email domain. PDF generation uses your logo and color scheme. The setup for each component takes 15-30 minutes and doesn’t require technical resources. This is one of the clearest advantages of Tier 2 for client-facing agencies.
Tier 3 n8n requires you to configure each component separately. CNAME setup involves pointing a subdomain at your VPS or a delivery service, which takes about 30 minutes and requires DNS access. SMTP configuration for email delivery needs either a transactional email service (SendGrid, Postmark, or similar at $10-20/month) or your own SMTP server. PDF generation requires a downstream service like Reportr or a headless Chrome renderer. Each piece works well independently, but you’re assembling them rather than getting them pre-integrated.
Tier 1 Looker Studio doesn’t support per-client white-label in any meaningful sense. Report URLs are Google-hosted. Email delivery comes from Google. The only branding you can apply is within the report canvas itself, through logos and color schemes. If white-label client delivery is a requirement for your agency positioning, Tier 1 is not viable past the proof-of-concept stage.
Common SEO Analytics Reporting Mistakes That Kill Client Trust
The most trust-damaging SEO reporting mistakes share a pattern: they create expectations that reality doesn’t match. Automated seo reporting solves the data collection problem, but it doesn’t automatically solve the interpretation and communication problems that erode client relationships. These five mistakes appear consistently across agencies at all tiers.
Mistake 1 is mishandling data freshness expectations. GSC data lags 48-72 hours. If a client asks “what happened yesterday?” and you pull a GSC report showing incomplete data, you look like you don’t know what you’re doing. Set expectations explicitly in the first onboarding call: our reports reflect data from the prior week, not the prior 24 hours. One sentence in your onboarding email prevents twelve months of confused client questions.
Mistake 2 is not explaining the GA4 versus GSC clicks discrepancy. Clients who look at both dashboards will notice the numbers don’t match. They’ll assume someone made an error. A one-paragraph explanation in your report template (GA4 counts sessions, GSC counts search clicks, the two will differ by 5-25%, this is expected) prevents this recurring confusion entirely.
Mistake 3 is reporting numbers without narrative. Automated reports generate data. Clients pay for interpretation. A report that shows organic clicks dropped 15% without explaining what caused it and what you’re doing about it is a report that generates more anxiety than confidence. Every automated report needs a human-written 3-5 sentence narrative block at the top, even if the data collection was fully automated.
Mistake 4 is skipping anomaly callouts. If impressions dropped 40% on a priority URL and you didn’t flag it in the report, the client noticed anyway. Not flagging it signals you’re not watching closely. Anomaly callouts – even for issues you’ve already resolved – demonstrate active monitoring. Clients don’t pay for silence; they pay for attention.
Mistake 5 is leading with vanity metrics. Impressions going up is not a win if clicks are flat. Rankings improving is not a win if conversions are declining. Organize reports around metrics that connect to business outcomes first, traffic second, and impressions last. Inverting that order creates reports that look good but feel hollow when the client connects the numbers to their revenue.
FAQ: SEO Analytics Reporting Automation in 2026
How long does it take to set up automated SEO reporting?
Setup time depends entirely on which tier you choose. Tier 2 SaaS like AgencyAnalytics takes about 30 minutes per client for onboarding and connection. Tier 1 Looker Studio with Supermetrics takes roughly 10 hours for the initial template build, then 45 minutes per new client. Tier 3 custom n8n takes 6 hours of engineering time for the first working pipeline across all clients, then minutes per new client once the template workflow exists. All three pay back their setup time within the first reporting cycle.
What’s the cheapest way to automate SEO reporting for 10 clients?
Tier 2 AgencyAnalytics wins on total cost of ownership at 10 clients when you factor in setup time. The math: AgencyAnalytics at $120/month (10 clients at $12 each) versus Tier 1 Looker Studio at $130/month (Supermetrics connector) plus 10 hours of setup time. If your hourly billing rate is $100, the Tier 1 setup costs $1,000 in opportunity cost versus AgencyAnalytics at $30/month higher with 30-minute onboarding. Tier 1 becomes cheaper only after 34 months of operation, assuming you don’t add clients.
Can I use n8n for SEO reporting without developer resources?
Yes for the basic 4-node template. n8n.io ships pre-built workflow templates for GSC and GA4 reporting that a non-developer can configure with API credentials and property IDs following their documentation. No for scaling beyond 10 clients or handling custom branding requirements. API quota management, OAuth token rotation, and the Sheets batch-write refactor described in this article all require debugging skills. Start with the pre-built template, and budget for developer support before the workflow grows beyond the template’s default scope.
What goes in the monthly client SEO report?
The 6 core KPIs: organic clicks, impressions, position trends, top movers, conversion attribution, and anomaly flags. Each KPI answers a different client question, from “are we getting more traffic?” through “is the traffic turning into revenue?” The canonical definitions, benchmarks, and template structure for all 6 KPIs are covered in our 6-KPI client report template. This article covers automation methodology; that article covers what to put inside the automated report.
How do I handle white-label branding with custom domain and branded PDF?
Tier 2 SaaS includes white-label branding (CNAME, SMTP, branded PDF) in the base subscription and takes 15-30 minutes to configure. Tier 3 n8n requires separate configuration of each component – CNAME via DNS, SMTP via a transactional email service, PDF via a downstream renderer. Both support full white-label. Tier 1 Looker Studio does not support per-client white-label; all reports are Google-hosted and Google-branded. If white-label delivery is a requirement, Tier 1 is not viable for external client-facing reporting.
From 4 Hours to 42 Seconds: The Real Operational Win
The 28x speedup from manual reporting to Tier 1 Looker Studio is the most accessible improvement in this framework. It requires no developer. It requires no recurring software cost beyond the Supermetrics connector. And it frees enough time in the first month to justify the 10-hour setup investment several times over. Most agencies should start here, not at Tier 3.
The move to Tier 3 custom n8n – where our 8-client benchmark hit 42 seconds end-to-end – is a different kind of win. It’s not just faster. It’s structurally different. When report generation takes 42 seconds and runs on a schedule, reporting becomes infrastructure rather than labor. The constraint shifts from “do we have time to pull the report?” to “what narrative do we attach to the data that arrived automatically?” That shift changes how agencies price their services, how they staff their teams, and how clients perceive the value of the engagement.
The tier you choose today doesn’t have to be permanent. Start with Tier 1, validate your reporting workflow, and move to Tier 2 when white-label requirements emerge. Move to Tier 3 when client count crosses 15 and a developer is available. The 3-tier framework is a progression, not a one-time selection. For broader tool evaluation before committing to infrastructure, our guide to broader tool comparison covers 8+ options across all three tiers. For the rank tracking methodology that feeds the data into these reports, rank tracking best practices is the operational companion to this article. For the 10-check optimization framework that feeds the metrics in this reporting workflow, see our content quality measurement workflow. For the AI Overview citation tactics that drive the AI visibility metrics in your reports, see our AI search visibility tracking. For the upstream editorial calendar planning behind the metrics in this reporting workflow, our 10-practice framework covers topic clusters and quarterly cannibalization audits. For the structured data layer that makes AI citation tracking possible in your reports, see our schema markup for AI citation reporting guide. For the automation pipeline behind the image performance metrics in your reports (WebP file size, alt text coverage, multi-modal AIO selection rate), see our image SEO automation metrics. For agencies reporting on local clients, our local client reporting workflow covers the geo-grid + GBP metric overlay.