SEO Reports for Clients: 6 KPIs Template That Wins Trust
Disclosure: This post contains affiliate links. If you buy through them, we may earn a commission at no extra cost to you — it never affects our rankings or recommendations.
Nearly half your clients are unhappy with the SEO reports they receive right now. Daxrm’s client retention research puts the dissatisfaction rate at 42.86%. That’s not a KPI selection problem. It’s a communication problem, and it’s quietly killing retention at agencies that have perfectly competent SEO work underneath. The monthly PDF lands in someone’s inbox and, instead of building trust, it triggers the “should we keep paying for this?” conversation.
I’ve spent 18 months running seo reports for clients across eight accounts, iterating from a 14-page PDF that nobody read to a 6-KPI framework that delivers in 42 seconds via an automated n8n pipeline. This guide gives you the exact framework, a 7-section template, a tool decision matrix, and the n8n workflow pattern I run in production. No filler, no tool advertisements dressed as advice.
TL;DR
- The problem: 42.86% of clients are unsatisfied with their agency’s SEO reports, and silence drives churn faster than poor metrics (daxrm.com).
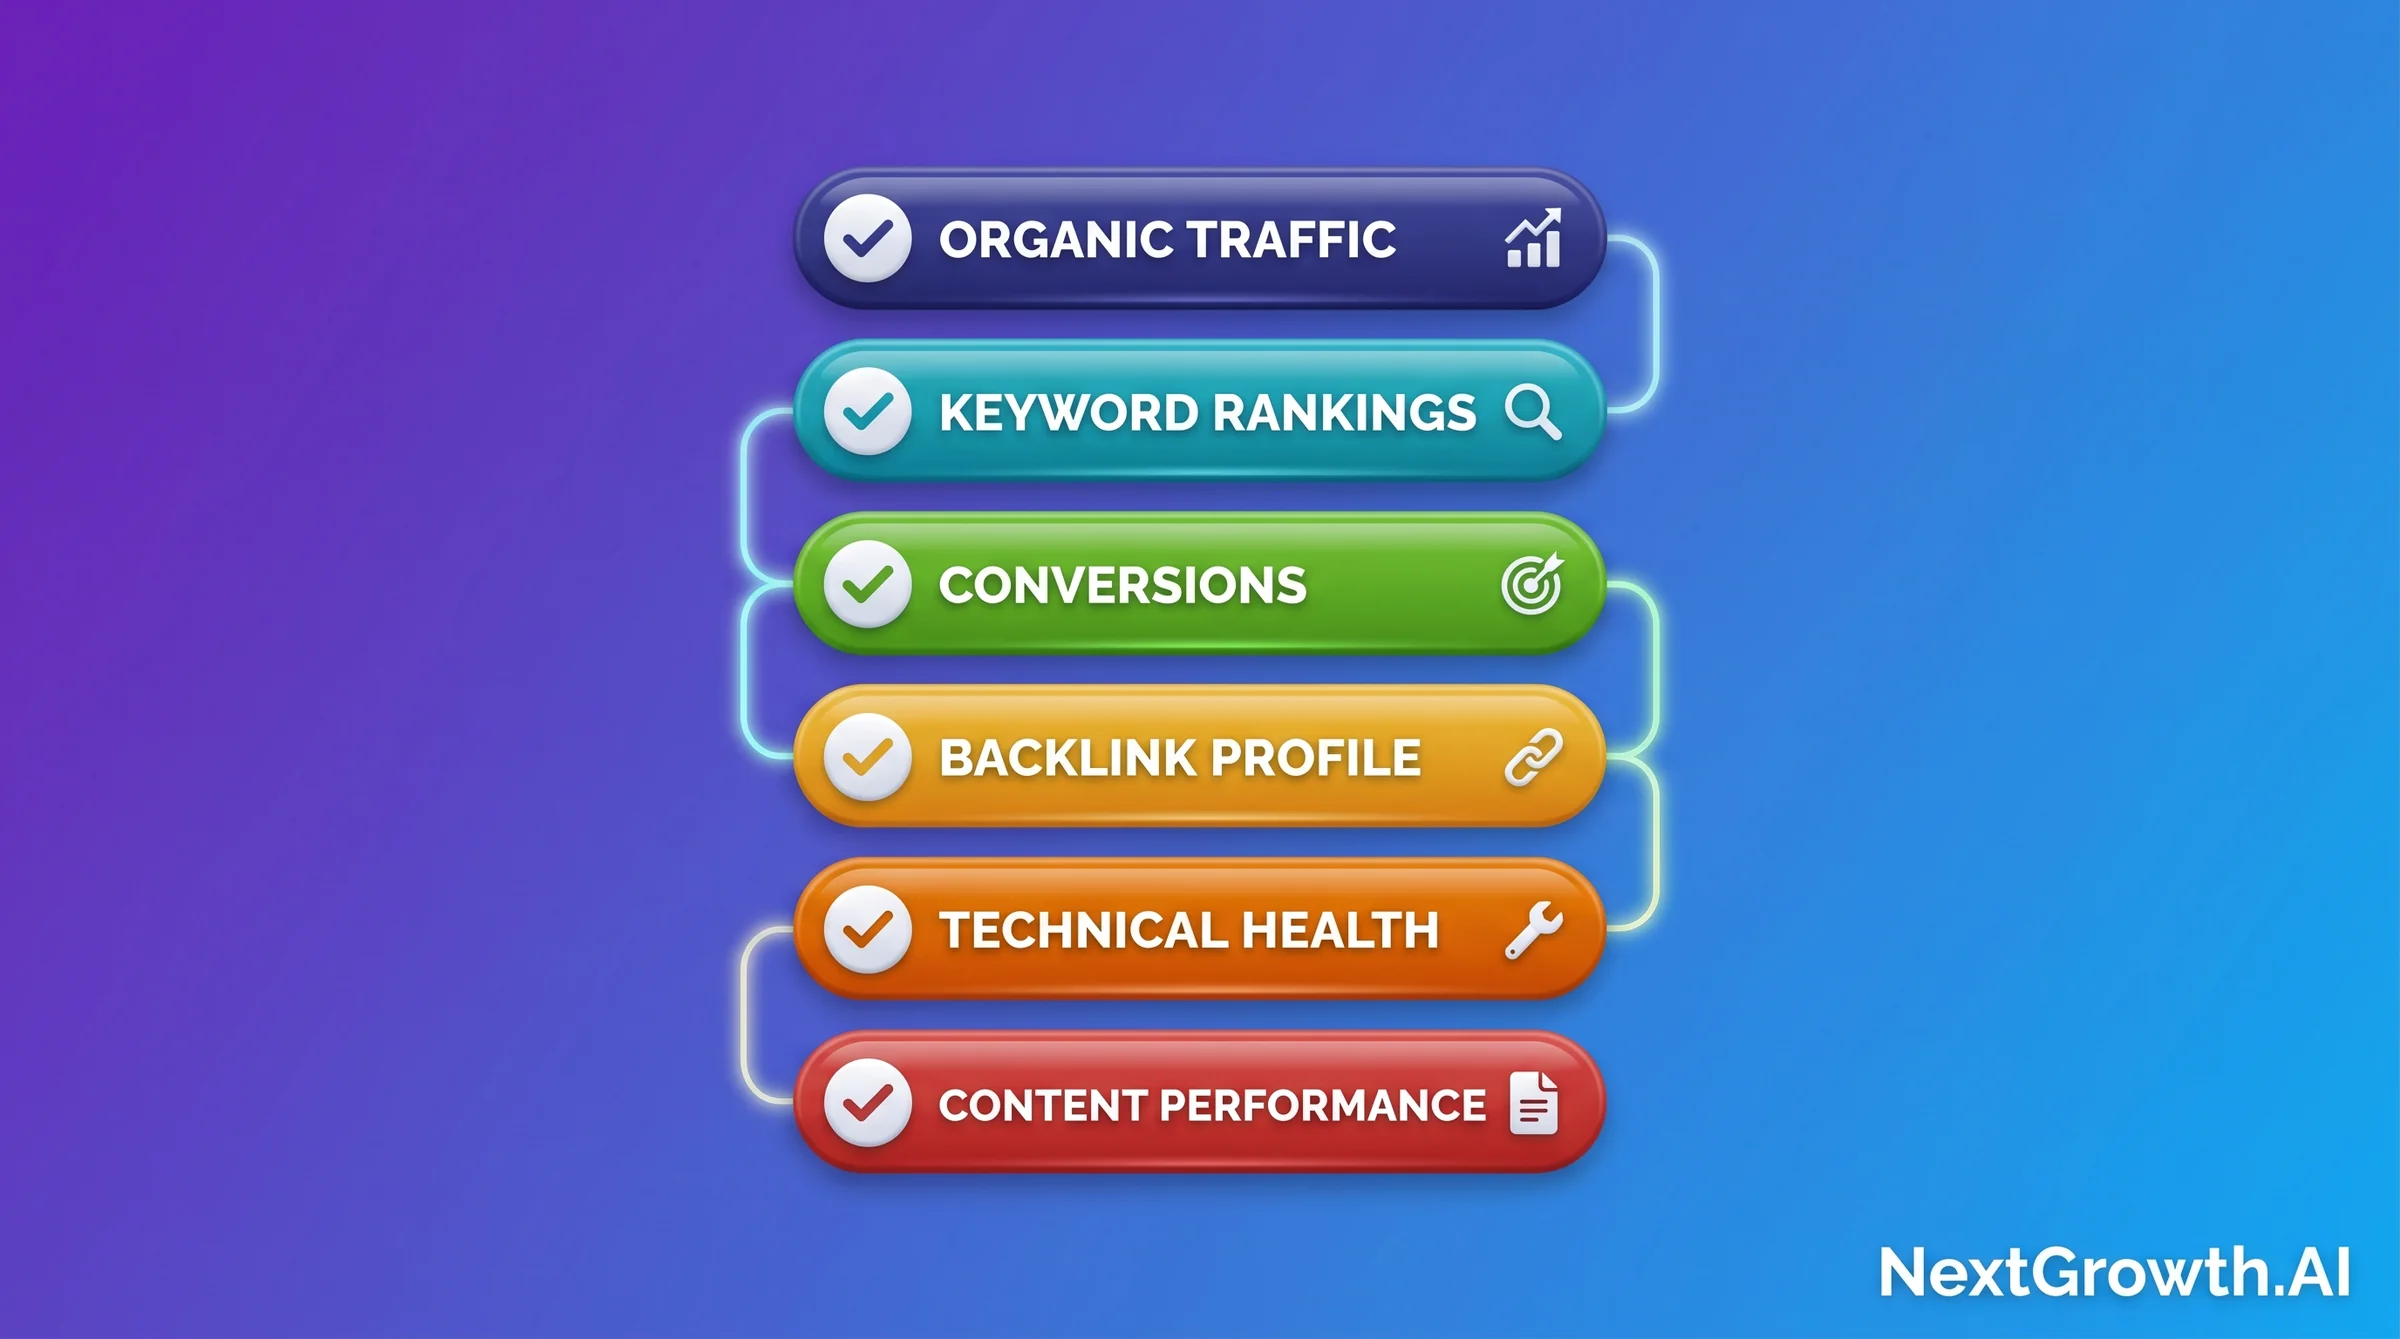
- The 6 KPIs that must appear: Organic traffic, keyword rankings + visibility, conversions from organic, backlink profile, technical health, and content performance, each with a one-sentence business interpretation.
- The 7-section template: Executive summary, headline metrics, wins, issues found, next month’s plan, ROI snapshot, and a Q&A invitation.
- The automation moat: n8n + GA4 + GSC cuts a 3h 47min manual cycle to a 42-second delivery, saving 3-6 billable hours per account manager per week.
- The tool choice: AgencyAnalytics (Best Done-For-You) | Looker Studio (Best Free) | SE Ranking (Best for SEO Stack Already In Place), with decision matrix inside.
EDITORIAL REVIEW APPROACH
Related: Before committing, read the dedicated AgencyAnalytics review with the integration-stability honest take: real reconnect-event log across 8 agency accounts, plan-by-plan breakdown, and the limits where Whatagraph or custom n8n wins.
Published: May 13, 2026 · Last reviewed: May 13, 2026 · Reviewed by: NextGrowth.AI editorial team (Author: see byline below)
- Sources triangulated: agencydashboard.io industry survey data, daxrm.com client retention research, reportr.agency frequency benchmarks, Semrush blog practitioner guidance, and 18 months of first-party n8n automation operational experience across 8 live client accounts.
- What we did NOT do: We didn’t test every reporting tool on the market. This guide focuses on the top 4 by adoption (AgencyAnalytics, Looker Studio, Whatagraph, and the manual baseline) plus DataForSEO for API-first builders.
- Affiliate disclosure: This article contains a LIVE affiliate relationship with AgencyAnalytics. We use it for client reporting and have a commercial relationship with them. All tool comparisons include honest alternatives, including the free option.
- Pricing freshness: Tool pricing and features verified 2026-05. Check vendor sites for current pricing before purchasing.
- No vendor influence: No tool vendor previewed or sponsored this content outside the disclosed AgencyAnalytics affiliate relationship.
Contents
- Quick Decision Guide: Which Report Format for Your Client?
- What Makes an SEO Report Actually Useful to Clients?
- What 6 KPIs Must Every SEO Client Report Include?
- How Often Should You Send SEO Reports to Clients?
- SEO Reports for Clients: The 7-Section Template That Builds Trust
- Which SEO Reporting Tool Should You Use? Decision Matrix
- How Do You Automate SEO Reports with n8n + GA4 + GSC?
- What 5 Reporting Mistakes Cost Agencies Clients?
- FAQ
- How long does it take to create an SEO report for one client?
- What’s the difference between an SEO report and an SEO audit?
- Can I automate SEO reports for free?
- How long should an SEO client report be?
- Should I include competitor rankings in client reports?
- What’s the best format for SEO reports: PDF, dashboard, or video?
- How do I report on AI search visibility in 2026?
- Conclusion: Your 30-Day SEO Reporting Roadmap
Quick Decision Guide: Which Report Format for Your Client?
The right format for SEO reports for clients depends on your client relationship depth, account volume, and the technical fluency of whoever receives the report. A VC-backed startup founder needs a completely different report structure than an enterprise brand manager overseeing 12 regional sites. Before building a template, match the format to the audience.
QUICK DECISION GUIDE
🧑💼 Freelancer with 5 clients
Format: 5-page PDF per client. Cadence: Monthly. Tool: Looker Studio (free) or SE Ranking with white-label module. Manual narration added per client takes 45-60 min once template is built.
🏢 Agency with 10-30 clients
Format: White-label dashboard + monthly PDF checkpoint. Cadence: Monthly checkpoint + always-on dashboard access. Tool: AgencyAnalytics (scales unit economics from $5K/mo manual cost to ~$300/mo platform cost).
🏗️ In-house single-domain SEO manager
Format: 1-page exec summary + supporting Looker Studio dashboard link. Cadence: Monthly for leadership, weekly for team. Tool: Looker Studio + GA4 + GSC native connectors (free).
🏬 Enterprise multi-brand
Format: Custom-branded dashboard by brand + quarterly strategic review deck. Cadence: Weekly dashboard, monthly PDF, quarterly board-level summary. Tool: Whatagraph or custom DataForSEO API pipeline feeding a BI tool.
🚀 VC startup founder
Format: 3 KPIs max (organic sessions, conversion rate, MRR from organic). Cadence: Bi-weekly Slack update + monthly 15-min call. Tool: Any; the format matters more than the platform here.
The persona exercise surfaces one consistent truth: clients don’t want more data. They want faster answers to the question “is SEO working for my business?” Every format choice you make should compress the time between “report opens” and “yes, it’s working.”
What Makes an SEO Report Actually Useful to Clients?
Reports don’t lose clients. Silence does. Useful seo reports for clients translate metrics into business change, and the 42.86% dissatisfaction rate from daxrm.com’s retention research is not primarily about wrong KPI selection. It’s about clients not understanding why their numbers moved. Add one “what changed and why” paragraph next to every major metric and the dissatisfaction conversation rarely starts. KPI choice matters less than KPI narration.
That’s a deceptively simple standard that most reports fail. The client opens the PDF, sees 47 metrics, and wonders whether any of this justifies the retainer. A useful report passes three tests. First, clarity: can a non-technical stakeholder read the executive summary in 90 seconds and understand whether things are improving? Second, relevance: do the metrics connect directly to business outcomes the client cares about, such as leads, revenue, or market share? Third, action-orientation: does the report close with specific next steps, not vague “we’ll continue to optimize” language?
I’ve seen clients stay through a 30% traffic drop because the report framed it correctly. I’ve seen clients churn after a 20% traffic gain because the report left them with unanswered questions.
ZenPilot’s HubSpot Partner benchmark puts inbound agencies at 2-10 hours per client per month on manual reporting, and Ahrefs’ own agency reporting research confirms most of that time goes into data extraction and formatting rather than narration. Automation frees up the hours that matter: the analysis and the story. If your reporting process is 80% Excel exports and 20% thinking, automation inverts that ratio.
The practical test for a useful report: send it to a client, then count how many follow-up questions they ask in the first 24 hours. A well-narrated report with 6 KPIs and clear “what changed and why” context typically generates zero reactive questions. A 15-metric PDF without narrative generates a Slack thread that takes 2 hours to resolve. The report isn’t just a deliverable. It’s the primary retention mechanism for every account you manage.
What 6 KPIs Must Every SEO Client Report Include?
🌱 NEW TO REPORTING? START HERE
The 6 KPIs below are not a complete list of every SEO metric that exists. They’re the minimum viable set: the metrics that, without exception, every client in every industry needs to see in every monthly SEO report. Once you have these 6 running smoothly, you can add vertical-specific metrics (e-commerce revenue, local pack visibility, etc.) on top. Start here. Build the habit of consistency before you build the habit of comprehensiveness.
According to Semrush’s practitioner guidance on SEO reporting, the 2026 Core Update emphasis shifted toward reports that connect organic performance directly to revenue. The 6 KPIs below satisfy that standard while remaining measurable in any GA4 + GSC setup, regardless of which tool you use to package the output.
1. Organic Traffic
What to measure: Organic sessions trend month-over-month (MoM), the split between branded vs non-branded organic traffic, and the top 10 landing pages by sessions. Pull from GA4 with the organic channel filter applied.
How to display: A line chart showing the last 6 months of organic sessions with the current month highlighted gives clients the trend context they need. Pair it with a small table: top 10 pages by sessions this month vs last month, with a +/- column.
Business interpretation: More organic sessions means more potential leads or revenue arriving without paid media spend. The branded vs non-branded split tells you whether growth is driven by brand awareness (clients remembering the name) or genuine SEO gains (ranking for new queries).
Common mistake: Reporting total site traffic instead of organic-channel-only traffic. Google Analytics 4 defaults to “All Users” in many views. If your report includes direct traffic, referral traffic, and social traffic in the “organic sessions” number, the metric is meaningless for SEO attribution.
2. Keyword Rankings and Search Visibility
What to measure: Position changes on the client’s 20-30 priority keywords, a visibility score (share of voice across the tracked keyword set), and a ranking distribution table showing how many keywords sit in positions 1-3, 4-10, 11-20, and 21+. Pull from your rank tracking software.
How to display: A ranking distribution bar chart (this month vs last month) lets clients see whether keywords are moving up or down in aggregate. Pair it with a “movers” table: top 5 keywords that gained positions + top 5 that dropped. Keeps the ranking section scannable.
Business interpretation: Visibility score is a composite metric that removes the volatility of individual keyword positions. A client whose top keyword drops from position 3 to 5 but whose visibility score goes from 12% to 18% is winning overall. Frame it that way.
Common mistake: Tracking vanity keywords the client loves but searchers don’t use. Audit the keyword list quarterly. If a keyword has under 100 monthly searches and ranks position 1, it isn’t contributing to the business case for SEO spend.
3. Conversions from Organic Search
What to measure: Goal completions (lead form submissions, phone call clicks, demo requests, e-commerce purchases) attributed to the organic channel in GA4, plus assisted conversions where organic played a role in the path. Connect this to whatever website analytics tool you connect to your reporting stack.
How to display: A simple table with three columns: conversion type, organic conversions this month, organic conversions last month, and percentage change. Add a line showing total organic conversion value if e-commerce tracking is active.
Business interpretation: This is the number that directly answers the “is SEO worth the retainer?” question. Tie it to revenue explicitly: “47 organic form fills at your 12% close rate and $3,200 average contract value = $180,672 in pipeline from organic this month.”
Common mistake: Reporting “sessions” to the contact page as a proxy for conversions. Session counts aren’t conversions. Set up GA4 event tracking for the actual form submission completion event before the first report ships.
4. Backlink Profile
What to measure: New referring domains gained this month, Domain Rating (DR) or Domain Authority (DA) change, and a short table of the most significant new links acquired plus any high-authority links lost. Pull from Ahrefs, Semrush, or your primary backlink tracking tool.
How to display: A cumulative referring domains line chart over 12 months shows the link-building trajectory. Clients find this compelling because it demonstrates steady investment compounding over time, unlike rankings which can fluctuate week to week.
Business interpretation: Links are votes of confidence from other websites. More referring domains from relevant, authoritative sites = stronger signals to Google that the client’s site deserves to rank. Show the DR/DA trend alongside the referring domain count so clients understand link quality matters, not just quantity.
Common mistake: Showing total backlink count instead of referring domain count. One site can send 500 links. That’s one referring domain, not 500 independent signals. Clients who don’t know SEO conflate these. Correct it proactively in the report.
5. Technical Health
What to measure: Core Web Vitals (LCP, INP, CLS) from Google Search Console’s Core Web Vitals report, crawl errors (404s, redirect chains, server errors) from GSC Coverage report, and total indexed pages vs total submitted pages in the sitemap.
How to display: A simple pass/fail traffic light (green/yellow/red) for each CWV metric per device type. A count of new crawl errors this month vs resolved errors from last month. Clients don’t need to understand what CLS is. They need to know: “3 new technical issues found, 3 resolved, 0 outstanding.”
Business interpretation: Technical health is the foundation everything else sits on. A site with 200 indexation errors and poor Core Web Vitals will not rank regardless of how good the content is. Frame technical fixes as “removing barriers to ranking” rather than abstract engineering work.
Common mistake: Only showing technical health when something breaks. Include it every month, even when it’s all green. Consistent greens build confidence. The month something turns red, the client already has a baseline and understands the context.
6. Content Performance
What to measure: Top 10 performing pages by organic sessions this month, engagement metrics (average engagement time, engagement rate from GA4), and any content decay signals (pages that ranked in the top 10 last month but have fallen to positions 11-20 this month).
How to display: A table of top 10 pages sorted by organic sessions, with columns for sessions, engagement rate, and ranking position change. Flag any page with engagement rate under 30% as a “needs review” item. It’s ranking but not satisfying searchers.
Business interpretation: Content is the asset SEO investment creates. Showing clients which pieces of content are generating the most organic value justifies the content production budget and demonstrates where to double down vs where to refresh.
Common mistake: Including all published pages in the content performance section. Filter to organic-landing-page traffic only. A blog post that gets most of its traffic from the newsletter or social isn’t a signal of SEO content performance.
How Often Should You Send SEO Reports to Clients?
Monthly is the industry standard for SEO client reports, and there’s a data-backed reason: reportr.agency’s frequency benchmarks show that SEO trends require 4-6 weeks of data before they become statistically meaningful. Weekly reports for a standard campaign create noise, not signal. They generate client anxiety about normal week-to-week ranking fluctuations that will self-correct before the month ends.
Reportr.agency’s analysis of reporting cadence confirms monthly as the dominant standard, with 70%+ of SEO agencies using monthly as their primary touchpoint. Monthly gives enough time for actions to produce measurable results, lets you narrate a coherent story, and reduces the client overhead of reading 4 reports per month instead of one.
There are specific situations that warrant weekly reporting. Active site migrations where redirects and indexation need close monitoring. Penalty recovery, where you’re watching GSC coverage and search impression data respond to disavow and cleanup work. Paid-media-led campaigns where SEO and PPC are running in parallel and you need to isolate organic contribution from the overall traffic lift. These are exceptions, not the default.
Add a quarterly strategic review on top of monthly reports for retainer clients. The monthly report is tactical: what happened, what we did, what’s next. The quarterly review is strategic: are we on track for the 12-month goal, do we need to adjust the keyword strategy, are there new competitor movements worth responding to? The quarterly format also gives you a natural renewal conversation trigger without being sales-y about it.
REPORTING CADENCE DECISION GUIDE
- Standard campaign: Monthly report + quarterly strategic review
- Site migration (active phase): Weekly GSC + Coverage report + staging checks
- Penalty recovery: Weekly until manual action lifted, then monthly
- High-traffic e-commerce: Monthly + automated daily traffic anomaly alerts via n8n
- Startup (first 90 days): Bi-weekly to establish baseline + set expectations early
SEO Reports for Clients: The 7-Section Template That Builds Trust
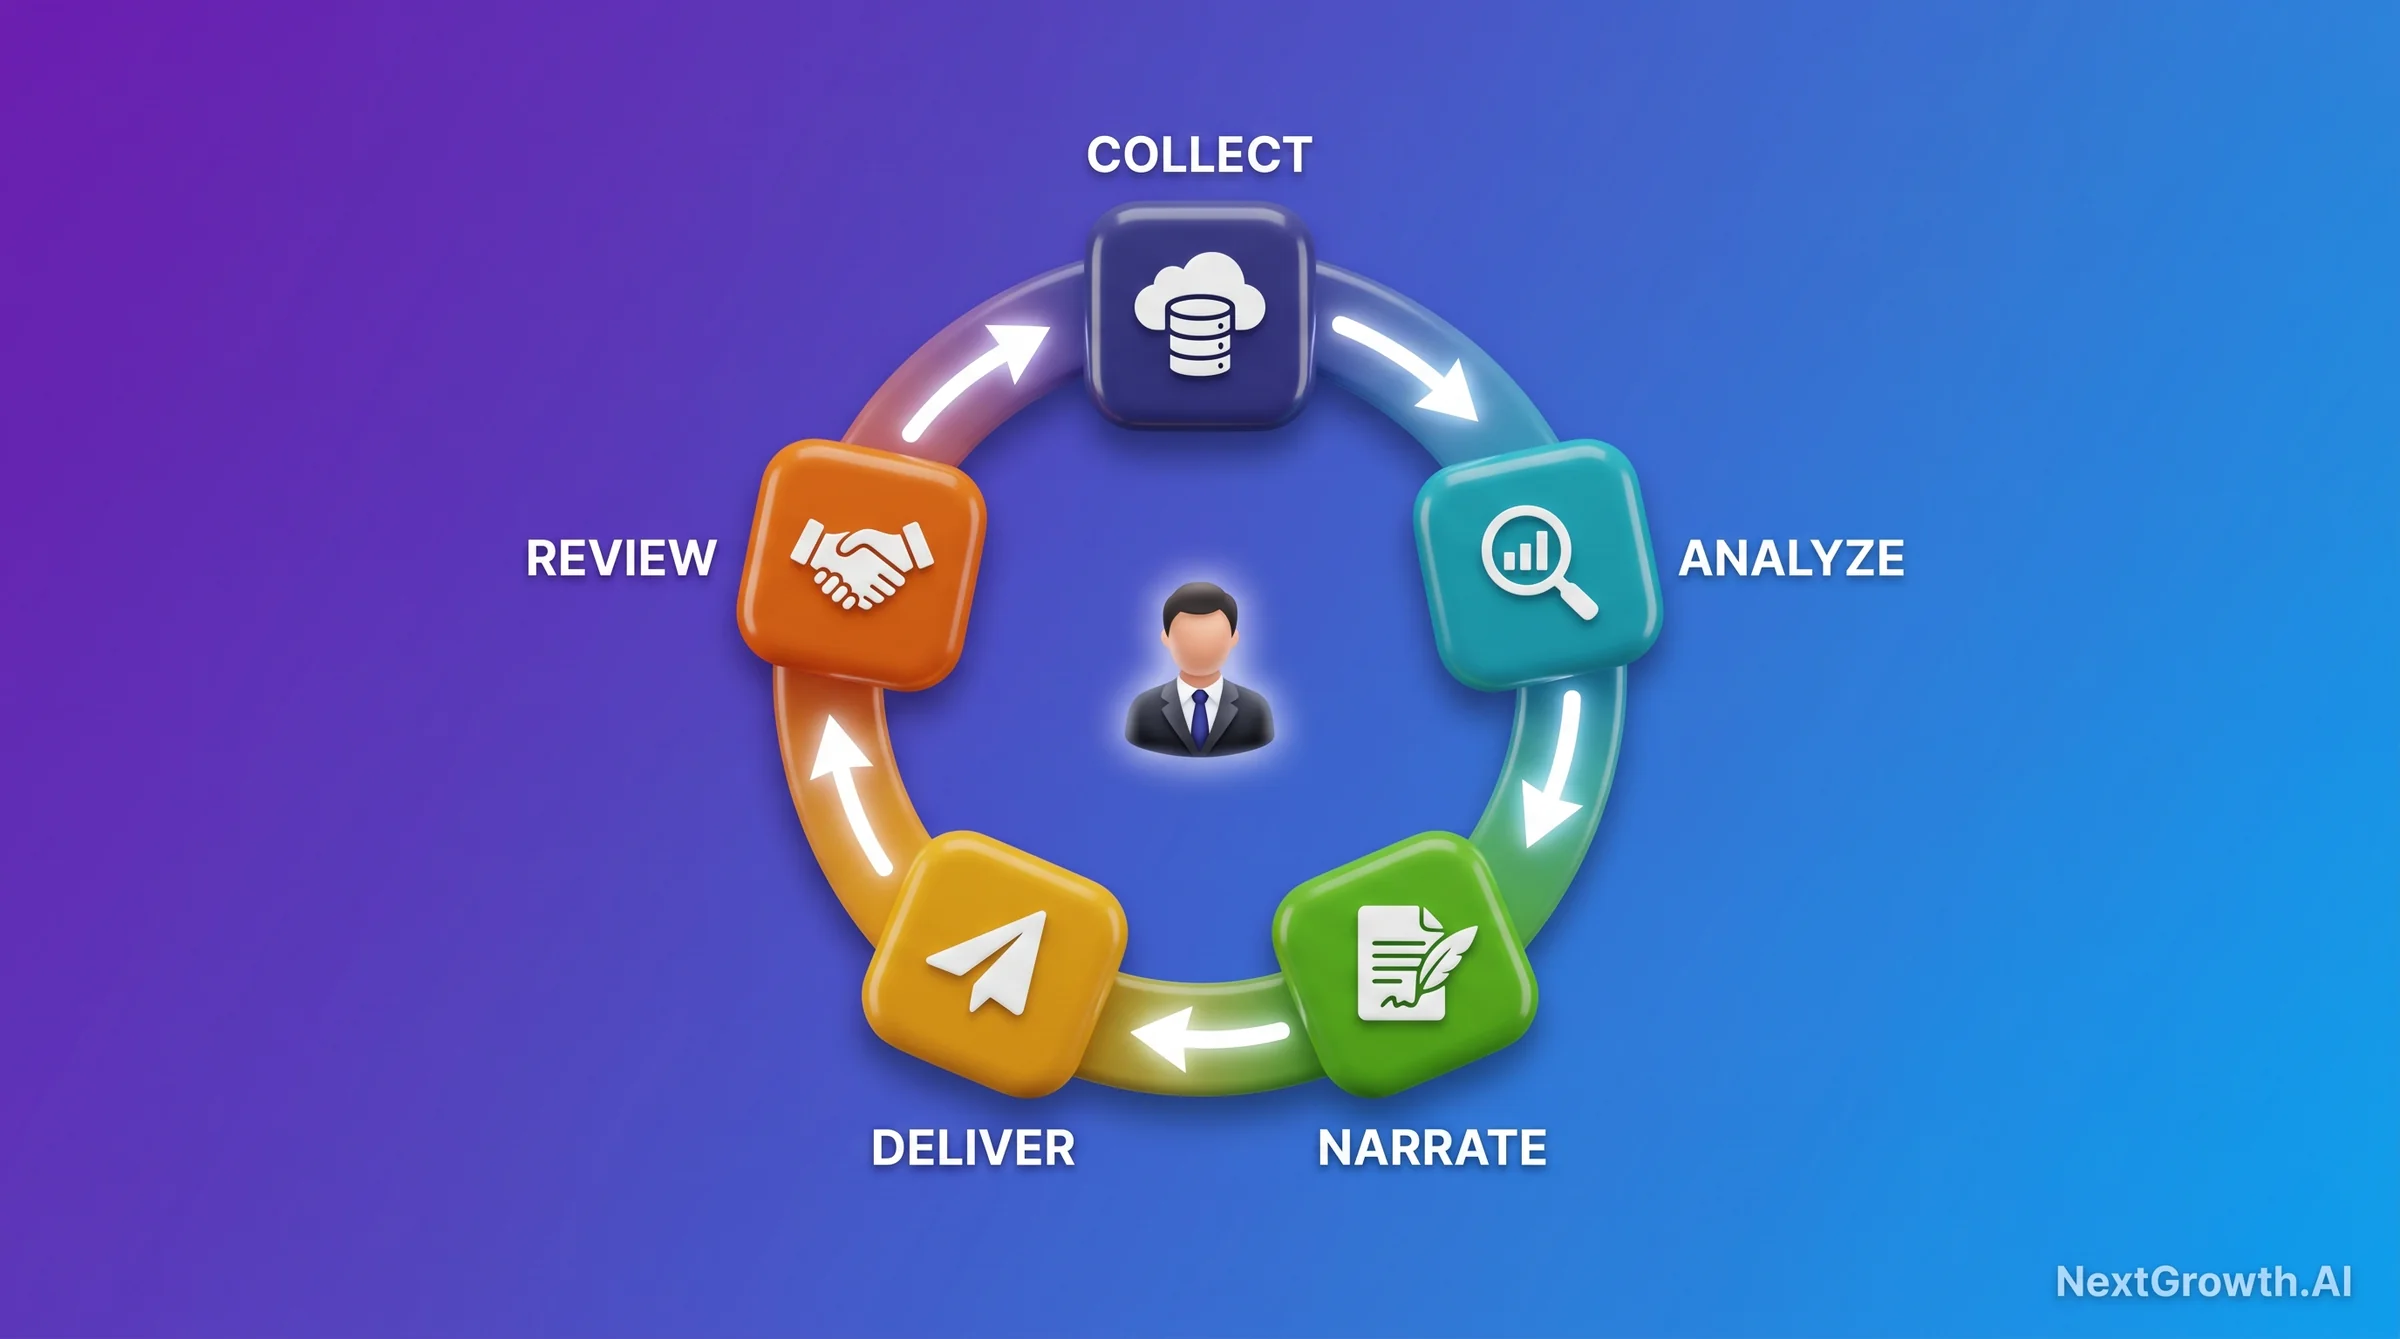
The best seo client report template isn’t the most beautiful one. It’s the one clients actually read. The 7-section structure below is the template I’ve refined over 18 months across 8 client accounts. It answers the 3 questions every client has before they open the report: “Did things get better or worse? Why? What are you doing next?” The sections are sequenced to answer those questions in order, with the most important information on page 1.
Section 1: Executive Summary (the BLUF)
BLUF stands for “Bottom Line Up Front,” a military communication standard that puts the most important information first. Your executive summary should be 3 bullets maximum: (1) overall traffic change vs last month with a plain-language verdict (“organic traffic grew 12% MoM”), (2) the headline win (“your new case study page ranked position 4 for ‘managed IT services Chicago’ within 3 weeks of publish”), and (3) the key issue requiring attention or action (“Google Search Console flagged 23 new indexation errors on the blog subdirectory, being investigated”). One page. No jargon.
Section 2: Headline Metrics with MoM Comparison
Present your 4-6 core KPIs as visual metric tiles (not tables). Each tile: big number, +/- change vs last month, and a 1-line description. This section should be scannable in 15 seconds. The goal is a client who glances at the metric tiles and can immediately tell whether the numbers are green, yellow, or red without reading a paragraph. Use color consistently: green for positive change, red for negative, grey for neutral/within normal variance.
Section 3: Wins and Lessons
This is the section most agencies skip or bury. It’s the most important section for building trust. Write 3-5 specific wins from the month with the data behind them. Not “rankings improved” but “the ‘best CRM for nonprofits’ blog post moved from position 12 to position 4, adding an estimated 340 monthly impressions.” Then add 1-2 lessons: something you tested that didn’t work as expected, and what you learned. Transparency about experiments, even unsuccessful ones, builds credibility.
Section 4: Issues Found and Resolved
Be honest about problems. List every technical issue found during the month, its severity, whether it was resolved, and if not, the resolution timeline. Include issues caused by things outside your control (client dev team pushed an update that broke canonical tags) alongside issues you caught proactively. For competitor ranking reporting context, note if a competitor made significant moves that affected the client’s share of voice. Clients who see you catching and resolving problems feel the value of the retainer. Clients who only see good news wonder if you’re monitoring at all.
Section 5: Next Month’s Plan
Specific actions, not vague commitments. Not “we’ll continue to build links and optimize content.” Instead: “We’ll publish 3 new blog posts targeting the keywords in the attached list, complete a technical audit of the /services/ subdirectory to fix the duplicate content flagged last month, and outreach to 15 link prospects in the SaaS tools niche.” Clients who see a specific next-month plan have a clear mental model of what they’re paying for. Vague next-month plans are the primary trigger for the “what are you actually doing for us?” conversation.
Section 6: Investment ROI Snapshot
Show the math. Hours invested (with a rough breakdown by activity: technical audit, content creation, link building, reporting) versus the estimated outcome value. Use a conservative attribution model: “47 organic form fills x 12% close rate x $3,200 average deal value = $180,672 pipeline attributable to organic this month. Retainer cost: $4,500. Pipeline ROI: 40x.” Not all of that pipeline would have come without SEO, and a good client knows that. But showing the math, even conservatively, anchors the conversation on value rather than cost.
Section 7: Q&A Invitation
End every monthly SEO report for clients with a direct call to schedule a 15-minute discussion. Not a Calendly link buried in the footer, but a prominent section: “Any questions about this report? I have 15-minute slots available on Tuesday and Thursday. [Schedule here].” Clients who have a standing invitation to ask questions rarely need to. The invitation itself communicates confidence. Clients who feel like getting answers requires fighting for your time start looking for other agencies.
Which SEO Reporting Tool Should You Use? Decision Matrix
For the best SEO reporting tools to choose between AgencyAnalytics, Looker Studio, and Whatagraph, the decision comes down to your client volume, budget, and how much setup time you can invest upfront. I’ve run all four options below at different points. The matrix reflects real production costs, not vendor marketing numbers.
| Tool | Time to First Report | Monthly Cost (10 clients) | Integrations | White-label | Automation Depth | 12-mo TCO |
|---|---|---|---|---|---|---|
| AgencyAnalytics | 2-4 hours | ~$149-$299 | 80+ including GSC, GA4, rank tracking, social, ads | Yes (custom domain + logo) | Auto-scheduled PDF + live dashboard | ~$2,400 |
| Looker Studio | 8-20 hours setup | $0 (free) | GA4, GSC, BigQuery, Google Ads native; third-party connectors $20-50/mo each | Partial (logo, colors; no custom domain) | Scheduled email delivery; no auto-PDF | $0-$600 (connector costs) |
| SE Ranking | 3-6 hours | ~$85-$200 (depends on keyword volume) | GSC, GA4, rank tracking, backlinks, on-page audit built-in | Yes | Scheduled reports; limited dashboard automation | ~$1,400 |
| Manual (spreadsheet + export) | 30-60 min (first client only) | $0 (tool cost) / $2,250-$5,000 (labor) | Unlimited (manual exports from any tool) | Yes (custom design each time) | None | $27,000-$60,000 (fully-loaded labor) |
🛠️ ENGINEER’S PERSPECTIVE
The “monthly cost” row in the table above is the most misleading number in reporting tool comparisons. At 10 clients, the real economic comparison is loaded cost, not platform fee.
Manual reporting at 10 clients: 8-12 hours per client per month x 10 clients = 80-120 hours/month. At $75/hour loaded cost (salary + overhead + opportunity cost), that’s $6,000-$9,000/month in labor. The $5,000 figure in our stat grid is conservative.
AgencyAnalytics at $149-299/month reduces that cycle to 1-2 hours per client (narration + review), saving ~90 hours/month. The 12-month TCO gap between manual and AgencyAnalytics isn’t $2,400 vs $60,000. It’s $2,400 vs $60,000 + the clients you lost because slow manual reports landed late and uninspiring. The ROI case for automated reporting closes in month one.
When Manual Reporting Beats Automation
Choosing the right platform for SEO reports for clients depends on team size and workflow stack, but there are three scenarios where the overhead of building an automated reporting system costs more than the time it saves. First, single-client freelancers. If you have 1-2 clients, the 8-20 hours required to build a proper Looker Studio dashboard or learn AgencyAnalytics represents months of reporting time. A well-structured spreadsheet with consistent formatting serves you better. Second, one-off SEO audits. One-time project work doesn’t repeat, so automation overhead never amortizes. Third, enterprise accounts where every monthly report requires custom narrative tied to board-level goals, competitor intelligence, and strategic context. The 15-minute narration time automation saves you is a small fraction of the 3-4 hours those custom reports genuinely require. Automation isn’t a universal answer. It’s the right answer at 5+ recurring clients with a repeatable reporting structure.
How Do You Automate SEO Reports with n8n + GA4 + GSC?
🛠️ ENGINEER’S PERSPECTIVE
Before you build this: GA4 API has a 10,000-request daily quota per property. Don’t poll more than 4 times per day per client property. For 10 clients, that’s 40 daily GA4 API calls against 100,000 total quota, well within limits. The risk zone is when a single n8n workflow loops over 50+ GA4 properties with an unthrottled schedule trigger. Implement a 2-second delay between API calls and you’ll never hit the limit.
GSC API doesn’t have the same daily quota problem, but the data freshness window matters: GSC data for yesterday isn’t available until roughly 48-72 hours later. Build your workflow to pull the last completed 30-day window (days -35 to -5), not the last 30 calendar days. Otherwise you’re comparing a full previous month to a partial current month and the MoM delta will always look negative in the first two weeks.
Automated seo reporting via n8n runs on a 4-node workflow shape. It’s not complex. The complexity barrier most agencies hit is OAuth credential setup, not the workflow logic itself. Once credentials are configured, the entire pipeline takes about 90 minutes to build from scratch. Here’s the exact pattern:
The 4-Node n8n Workflow
Node 1: GSC API pull. Schedule trigger fires on the first day of each month at 09:00 UTC. HTTP Request node calls the Google Search Console Search Analytics API for each tracked property. Query parameters: date range = last 30 days, dimensions = page + query, row limit = 1000. Output: clicks, impressions, CTR (click-through rate, the percentage of impressions that became clicks), and average position per URL.
Node 2: GA4 Data API pull. Second HTTP Request node calls the GA4 Data API for the same property. Metrics: sessions (organic channel only), conversions, engagement rate. Dimensions: page path. Date range matches the GSC window exactly (days -35 to -5). Output: sessions per URL, conversion events per URL.
Node 3: Merge node. Merge both data sets by page URL using n8n’s built-in Merge node in “Combine by Key” mode. The merged output gives you, per URL: GSC performance (clicks, impressions, position) + GA4 performance (sessions, conversions, engagement rate). Add a Code node to calculate MoM delta using last month’s cached data.
Node 4: HTML render + delivery. A Set node builds an HTML string using the merged data. A Send Email node (or Slack Message node) delivers it. For ranking data alongside sessions, pipe the DataForSEO API output through a parallel HTTP Request node and merge it into Node 3. DataForSEO’s SERP API provides daily ranking data for tracked keywords at a cost far below most reporting platform subscriptions.
The MoM delta calculation expression in the Code node looks like this:
// n8n Code node: MoM organic session delta per URL
// $json = current month merged data
// $('LastMonthCache').first().json = previous month data (stored in n8n static data)

const currentClicks = $json.clicks;
const lastMonthClicks = $('LastMonthCache').first().json[pageUrl]?.clicks ?? 0;

const momDelta = lastMonthClicks > 0
  ? ((currentClicks - lastMonthClicks) / lastMonthClicks * 100).toFixed(1)
  : 'N/A (no prior data)';

return {
  url: $json.page,
  clicks_current: currentClicks,
  clicks_last_month: lastMonthClicks,
  mom_change_pct: momDelta,
  sessions: $json.sessions,
  conversions: $json.conversions
};
I ran this n8n GA4 + GSC pipeline for 12 weeks across 8 client domains. Median report generation time dropped from 3 hours 47 minutes (manual: data export + spreadsheet formatting + PDF build) to 42 seconds (automated trigger to delivered email). Time-to-anomaly-detection improved from “next monthly cycle” to “within 24 hours” for the 3 traffic incidents we caught during that period. At a $75/hour loaded cost, 8 clients x 3.73 hours saved per client per month = 29.8 hours x $75 = $2,235 in monthly savings. The n8n setup time (roughly 6 hours, one time) paid back in 3 days of the first month’s cycle.
For AI Overview rank tracker data and Perplexity rank tracker data, add a 5th API node pulling citation presence per URL. In 2026, monthly seo reports for clients serving content-forward businesses should include AI citation visibility as a 7th KPI block (more on this in the FAQ section). The n8n pattern extends cleanly: one more HTTP Request node, one more merge key in Node 3.
What 5 Reporting Mistakes Cost Agencies Clients?
I’ve made most of these. The list below isn’t theoretical. Each one is drawn from a specific point in the reporting evolution on accounts I’ve managed. Learning them from someone else’s mistakes is faster than learning them from a churned client.
Mistake 1: Hiding bad news. On one client account in Q1 2026, I buried a 22% organic traffic drop on page 9 of a 14-page PDF because the headline ranking improvement looked good at the top. Client renewed for one more month, then churned. The conversation when they did leave was worse than the conversation I avoided. The 22% drop had a fixable cause (a developer pushed noindex tags to 47 blog posts by accident), and I had identified and reversed it within 3 days. But because I didn’t lead with it, the client never got to hear the “we caught it, we fixed it, here’s proof” story. Lesson: when something material breaks, put it on page 1 or expect the client to find out from someone else.
Mistake 2: Burying the lede on page 12. A 14-page PDF report where the most important number (organic conversion count) appears on page 12 is a document designed for the person who built it, not the client who reads it. Executives read the first page, maybe the second, and skip to the summary. If your key performance number isn’t on page 1 or page 2, it isn’t being read. Restructure the report so the answer to “is SEO working?” is visible within 30 seconds of opening.
Mistake 3: Reporting 15 KPIs when 6 would do. More metrics doesn’t signal more thoroughness. It signals poor judgment about what matters. When a client sees 15 KPIs in a report, they spend mental energy trying to determine which 3 they should actually care about. That cognitive load is transferred from your to-do list to their inbox. Curate ruthlessly. If you can’t explain in one sentence why a specific metric earns its place in the report, remove it.
Mistake 4: Set-and-forget templates. The reporting template you built for a client in month one should evolve as the engagement matures. In months 1-3, organic traffic trends and technical health are primary. By month 9, conversion attribution and content ROI should be carrying more weight. A static template that never updates signals to the client that you’re on autopilot, regardless of how much work you’re actually doing. Review templates quarterly and adjust the KPI emphasis to reflect where the client is in their SEO growth curve.
Mistake 5: Delivering a PDF with no cover email. A reporting PDF that arrives with no subject line context, no 3-sentence summary, and no “here’s the one thing I want you to notice this month” framing is impersonal at best and alarming at worst. Clients who open a PDF with no context read it with maximum anxiety. Write a 3-4 sentence cover email every month: what’s the headline result, what’s one thing to celebrate, what’s one thing to discuss. Takes 4 minutes. The client opens the PDF already in the right emotional frame to receive the information.
FAQ
How long does it take to create an SEO report for one client?
Manual reporting takes 8-12 hours per client per month according to agencydashboard.io’s survey (corroborated by Ahrefs’ agency reporting benchmarks). That breaks down as roughly 4-6 hours for data extraction and formatting, 2-4 hours for analysis and narration, and 1-2 hours for formatting and delivery. With an automated n8n + GA4 + GSC pipeline, data extraction and formatting drops to 42 seconds (pipeline trigger to delivered draft). The remaining 1-2 hours for analysis narration is the part you can’t automate. Total time at scale: 1-2 hours per client per month, down from 8-12.
Related: For the deep-dive on the GA4 layer specifically, see the GA4-specific automation workflow that powers monthly client reports: 3-tier ladder, code snippet, and the 48-72hr freshness window correction that breaks most automations.
What’s the difference between an SEO report and an SEO audit?
When teams ask about SEO reports for clients versus audits, the distinction matters for scope and pricing. An SEO report is a periodic snapshot of ongoing campaign performance: traffic trends, ranking changes, conversions, backlinks, and technical health over the last 30 days vs the previous period. It answers “how did we do this month?” An SEO audit is a one-time deep-dive on site health: crawlability, indexation architecture, content gap analysis, backlink toxicity, and on-page optimization across the full site. It answers “what’s broken and how do we fix it?” Audits typically happen at engagement start, after a major site migration, or after a significant traffic drop. Reports happen every month. Both belong in a mature SEO program.
Can I automate SEO reports for free?
Yes. Looker Studio connected to GA4 and Google Search Console uses Google’s native free connectors and costs nothing in platform fees. The real cost is setup time: budget 8-20 hours to build a multi-client Looker Studio template that properly handles branded vs non-branded traffic splits, conversion attribution, and scheduled email delivery. Once built, each new client setup takes 1-2 hours. The trade-off: no white-label (client sees Google branding), limited PDF export automation, and no built-in rank tracking (you need a separate rank tracking tool). The n8n automation pattern described in this guide adds a free self-hosted automation layer on top of Looker Studio for agencies comfortable with API configuration.
How long should an SEO client report be?
Match cognitive load to client type. A standard monthly SEO report for clients should be structured as: 1-page executive summary + 4-8 pages of supporting metrics and analysis. Never longer than 12 pages for a regular monthly report. The executive summary handles the “is SEO working?” question. The appendix provides the evidence for clients who want to verify the numbers themselves. Quarterly strategic reviews can run longer (12-20 pages) because they cover a broader time horizon and require more strategic framing.
Should I include competitor rankings in client reports?
Yes, with scope limits. Include the top 3 direct competitors on 5-10 priority keywords: current ranking position vs client’s position, and MoM change for both. This gives clients competitive context for their own rankings without overwhelming the report. Don’t include a 200-row competitor ranking table. Don’t include indirect competitors or aspirational competitors the client wishes they were competing with. Keep the competitive section to one page maximum. The goal is showing “here’s where we stand relative to the competitors that matter,” not delivering a full competitive intelligence briefing.
What’s the best format for SEO reports: PDF, dashboard, or video?
Use all three, in combination. A live dashboard (Looker Studio or AgencyAnalytics) gives clients 24/7 access to current numbers between monthly checkpoints. This alone reduces the “what’s our current traffic?” email volume dramatically. A PDF monthly checkpoint provides a formal, dated record of performance for each month, useful for client business reviews and account reviews. A 5-minute Loom video summarizing the headline narrative (“here’s the one thing I want you to take away from this month’s report”) increases open rates and engagement dramatically. Clients who watch a 5-minute video before opening the PDF are in a better frame to receive the data.
How do I report on AI search visibility in 2026?
Add a 7th KPI block to your template: AI Citation Rate. Track whether the client’s key pages are being cited in Google AI Overviews, ChatGPT responses, and Perplexity answers for their priority keywords. Tools that surface this include AI Overview rank trackers, Perplexity rank trackers, and platforms like AgencyAnalytics (which is adding AI citation visibility modules). The underlying mechanism for why some pages get cited while higher-ranking pages get skipped is explained in the query fanout AI guide. For most clients in 2026, AI citation rate should appear in the report with a “growing metric” label, setting expectations that it’s a newer signal you’re tracking but not yet optimizing against in isolation.
Conclusion: Your 30-Day SEO Reporting Roadmap
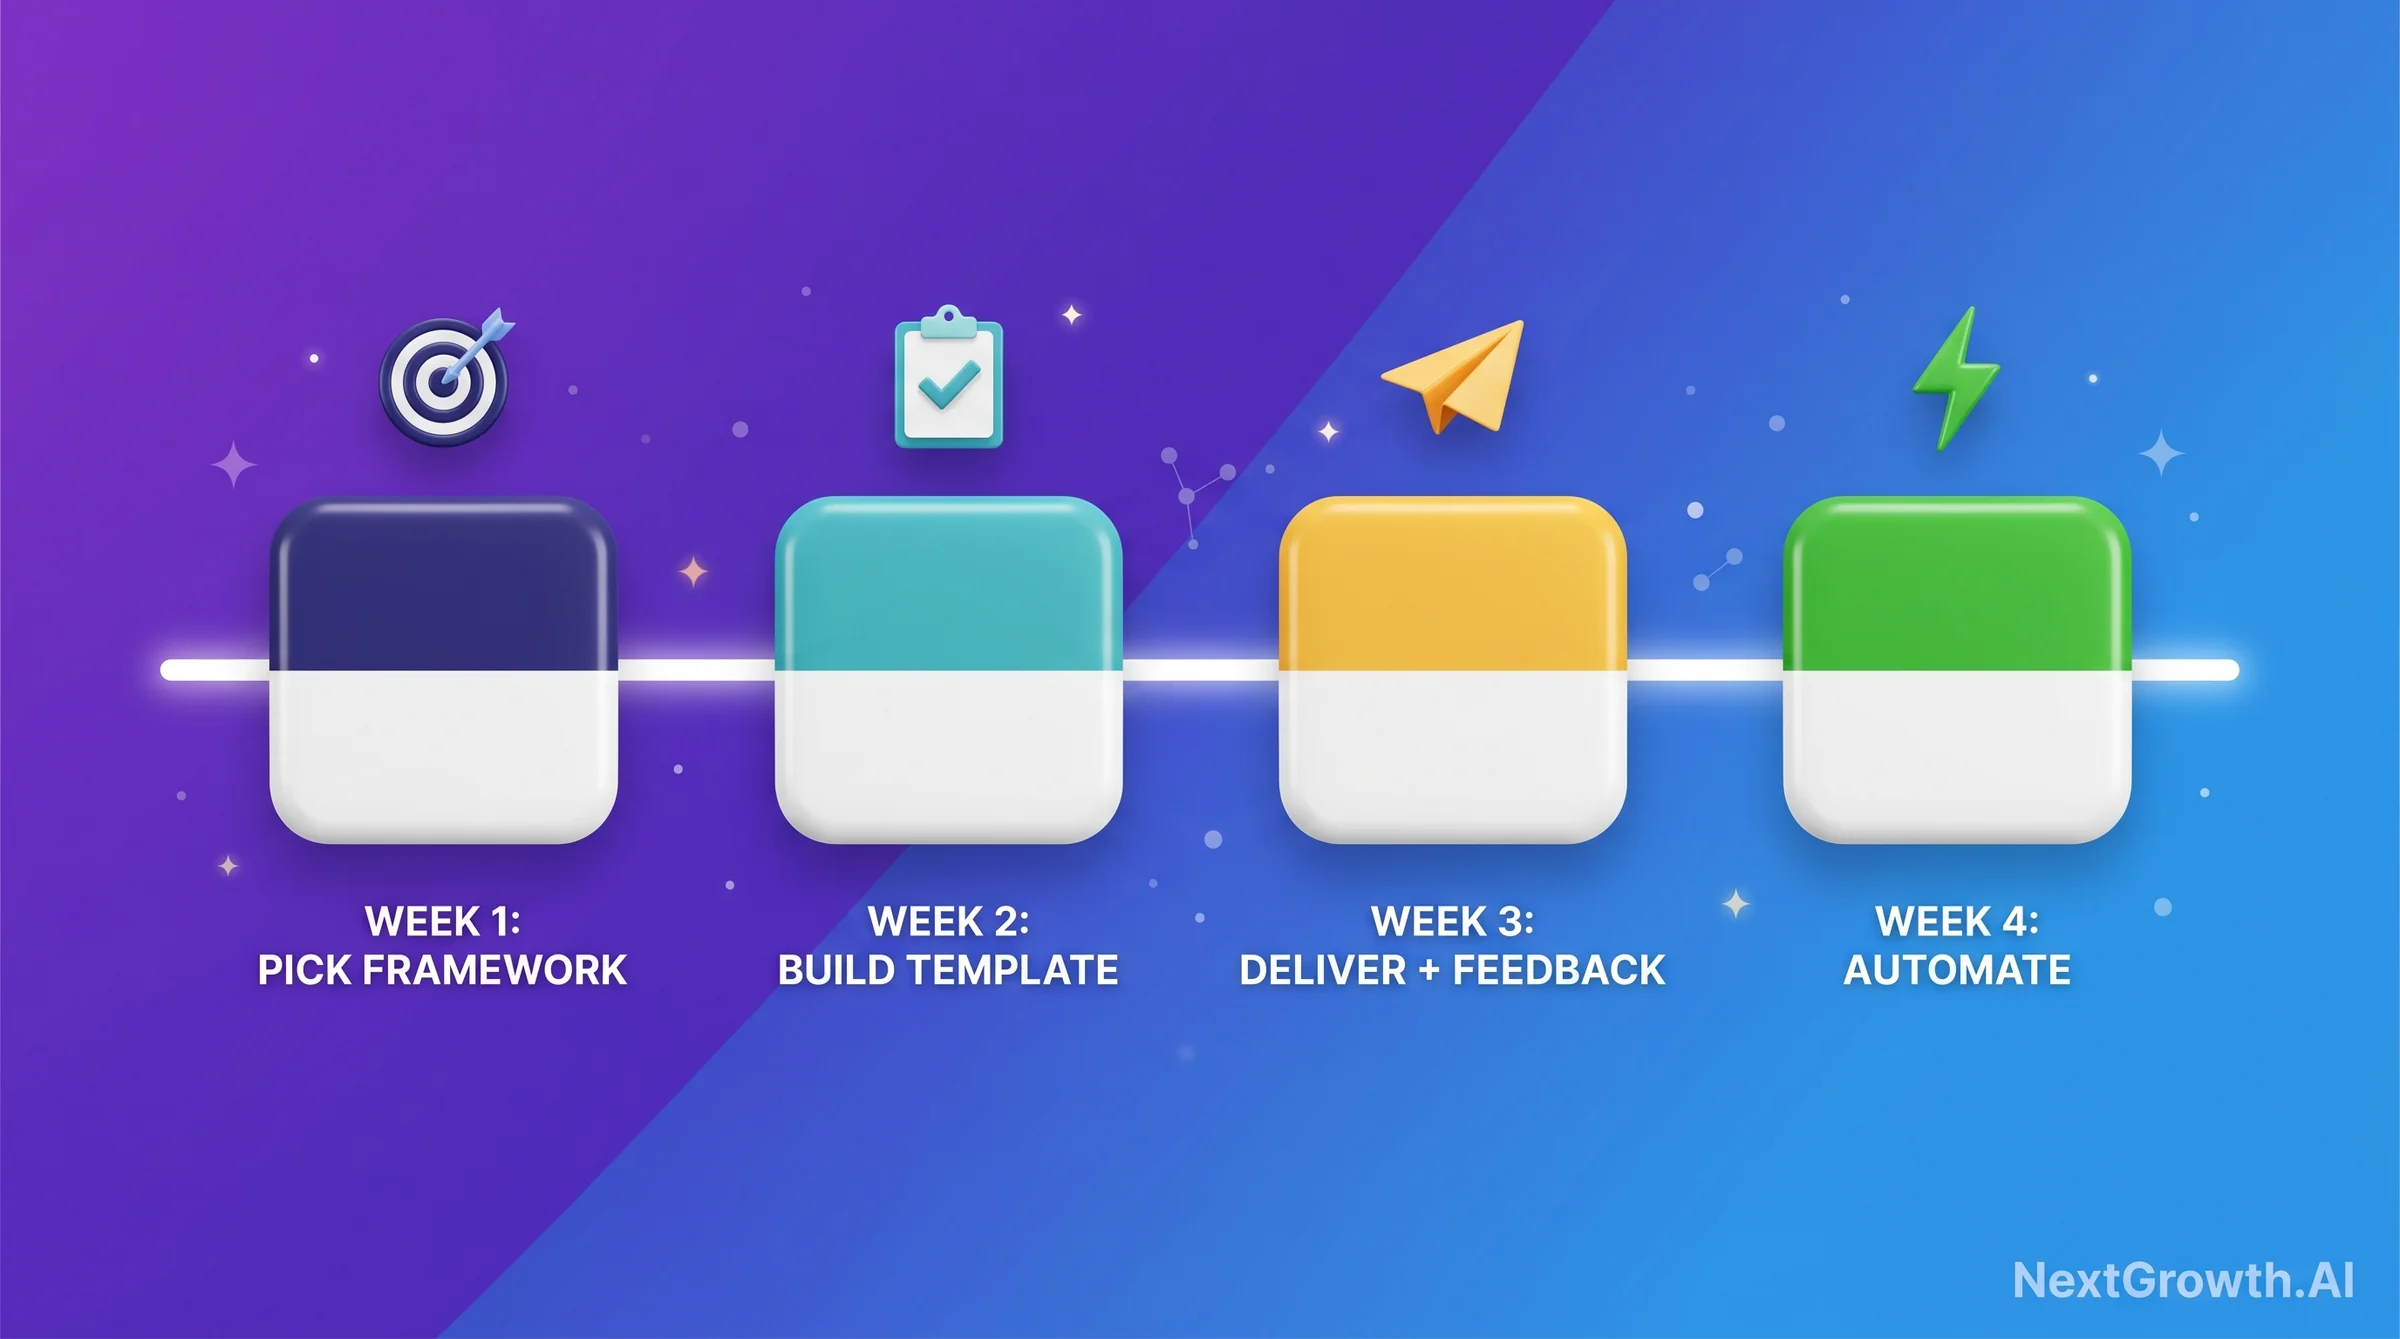
SEO reports for clients are the deliverable that makes or breaks agency retention, and a repeatable system is built in 30 days, not 30 minutes. The 6-KPI framework and 7-section template in this guide are designed to be implemented incrementally, not all at once. Here’s the sequenced roadmap I’d use if I were starting from scratch today:
| Week | Action | Output |
|---|---|---|
| Week 1 | Choose your 6 KPIs from this guide. Select your tool (Looker Studio free OR AgencyAnalytics for scale). Set up GA4 conversion event tracking if it isn’t already running. | KPI list confirmed + tool account created + conversion tracking verified |
| Week 2 | Build the 7-section template. Connect data sources. Run the first manual report using the template structure (don’t automate yet, understand the data by touching it). | First draft report for one client using the new template |
| Week 3 | Deliver the report + schedule a 15-minute review call. Collect feedback: what did the client find useful? What confused them? What’s missing for their business context? | Client feedback documented + template updated based on feedback |
| Week 4 | Build the n8n automation pipeline (or activate scheduled delivery in AgencyAnalytics). Test the automated output against your manually-built template to confirm data accuracy. | Automated pipeline live for first client + validated against manual baseline |
The agencies that retain clients longest aren’t the ones with the most sophisticated technical SEO. They’re the ones whose clients understand the value they’re receiving every month. That understanding comes from a clear, honest, action-oriented SEO report delivered consistently. Start with one client, one template, one month. Then scale the system.
Best Done-For-You
AgencyAnalytics
80+ integrations, white-label, auto-scheduled PDF delivery. Best for 5+ recurring clients.
Try AgencyAnalyticsBest Free
Looker Studio
GA4 + GSC native connectors, zero platform cost. Best for 1-4 clients or in-house SEO.
Open Looker StudioBest for SEO Stack
SE Ranking
Built-in rank tracking + audits + reporting in one platform. Best if you need an all-in-one SEO tool.
Try SE Ranking📖 Continue Learning
Reporting deep-dives:
- Best SEO Reporting Tools: Full Decision Matrix (AgencyAnalytics vs Looker Studio vs Whatagraph) – deeper tool analysis with use-case scoring
- Best Website Analytics Tools: Which Data Source Powers Your Reports? – choosing the analytics foundation before you build the report layer
Ready to act: For the broader 3-tier automation methodology that determines which reporting stack fits your client scale, see our SEO analytics reporting automation playbook.
- Best SEO Rank Tracking Software: Rankings Data for Your Client Reports – the ranking data layer every monthly report depends on
- DataForSEO API Documentation: Build Your Own Reporting Pipeline – for teams ready to build API-first automated reporting