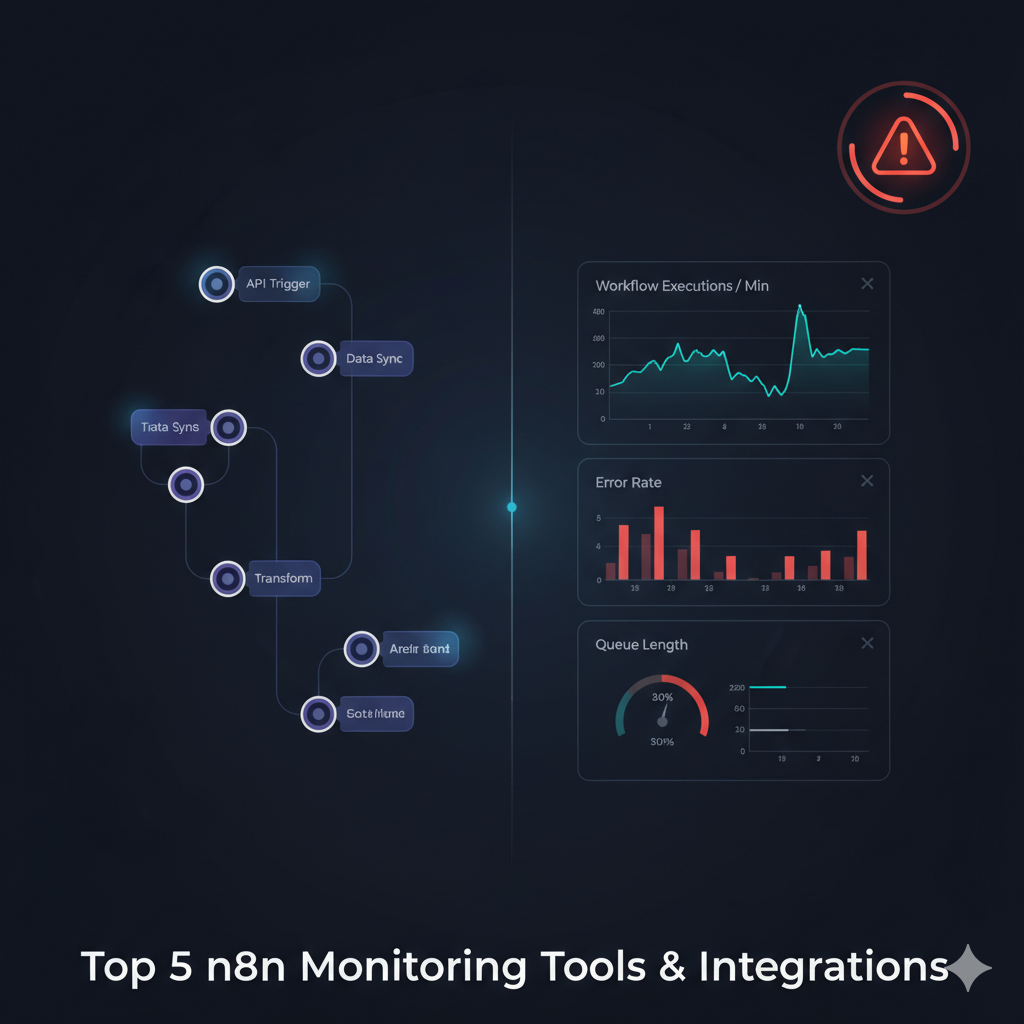
Top 5 n8n Monitoring Tools and Integrations in 2026
n8n monitoring tools and integrations let you see workflow failures, queue lag and memory pressure before they snowball into outages.
In the world of workflow automation, n8n offers unparalleled power and control. For more, see our guide on what n8n is. But with that power comes a critical responsibility: monitoring. For more, see our guide on n8n monitoring fundamentals. Without it, you’re flying blind. Silent failures can go unnoticed, performance bottlenecks can cripple your most important processes, and troubleshooting becomes a frustrating guessing game.
Finding the right monitoring strategy often leads to a flood of questions. You might be asking yourself:
- What are the built-in monitoring tools in n8n?
- What are the best tools for monitoring n8n overall?
- Are there any third-party services that specialize in this?
- How can I integrate n8n with powerful stacks like Prometheus and Grafana?
This guide was written to answer those exact questions. We will provide a clear, actionable comparison of the top 5 monitoring solutions, from n8n’s native features to enterprise-grade integrations. By the end, you’ll know exactly how to choose the right tools to ensure your automations run flawlessly and reliably.
Understanding Comprehensive n8n Monitoring Solutions
Effective n8n monitoring isn’t about a single tool; it’s about building a complete observability stack. This means having visibility into workflow executions, system health, and performance metrics. A good monitoring system allows you to move from reactive problem-solving to proactive optimization, ensuring reliability and efficiency.
General n8n Monitoring & Observability
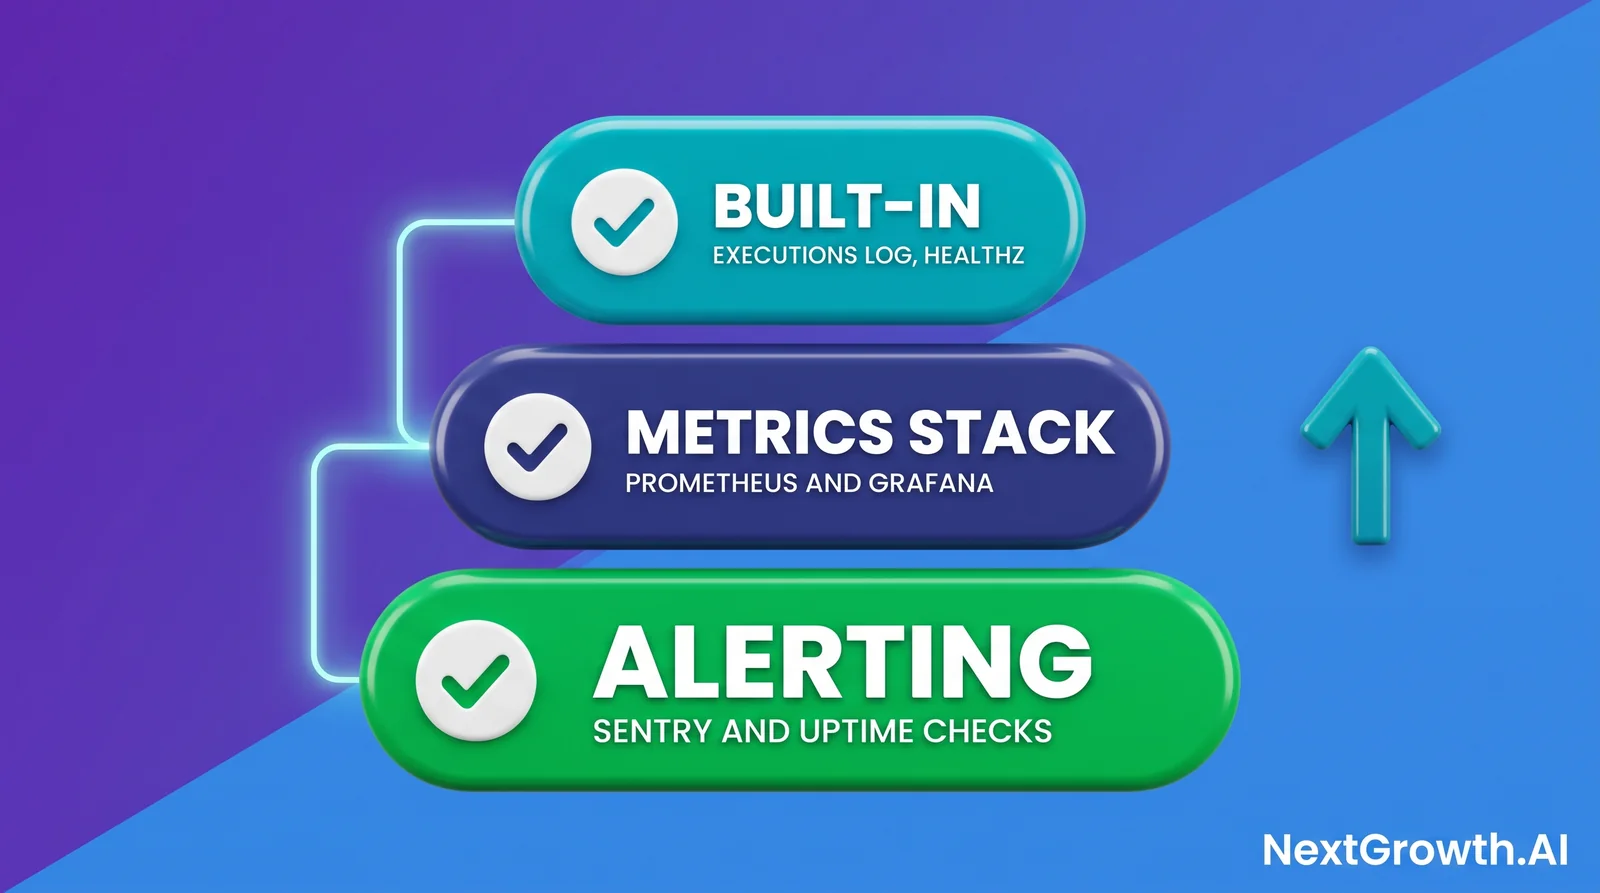
Before jumping to external solutions, it’s crucial to understand what n8n offers out of the box. These built-in features provide a foundational layer of n8n workflow monitoring that can be surprisingly powerful for many use cases.
| Tool / Feature | Description | Pros & Cons | Ideal Use Case |
|---|---|---|---|
| n8n’s Built-in Executions Log | The primary UI for viewing past/current workflow executions, showing successes, failures, and data for each node. | Pros: Simple, accessible, and requires no setup. Cons: Not for automated alerting or trend analysis; cumbersome for large volumes. | Developers actively building and debugging a new workflow. |
| Health Check Endpoint | A simple /healthz API endpoint that provides a basic liveness check for the n8n instance, as noted in the n8n documentation. | Pros: Fundamental for basic uptime monitoring. Cons: Only indicates if the service is running, not if workflows are failing. | Basic uptime monitoring with tools like UptimeRobot or StatusCake. |
These native options are the starting point for n8n observability. For small-scale deployments, they might be sufficient. However, as your automation complexity grows, you’ll need to layer in more specialized n8n monitoring and alerting tools to maintain control.
Deep Dive: Specific Integrations & Advanced Setups
For enterprise-grade reliability and deep performance insights, you need to integrate n8n with specialized third-party monitoring tools. These solutions unlock advanced capabilities like trend analysis, automated anomaly detection, and centralized logging.
n8n Integrations for Advanced Monitoring
Here, we compare the most powerful and popular integrations for taking your n8n monitoring to the next level, particularly for self-hosted with docker compose.
| Integration | Description | Pros & Cons | Ideal Use Case |
|---|---|---|---|
| Prometheus & Grafana | A powerful stack where Prometheus scrapes metrics from n8n’s /metrics endpoint and Grafana visualizes them in dashboards. Considered a gold standard for modern systems. | Pros: Highly customizable for visualizing trends (e.g., queue length, execution time). Cons: Significant setup and maintenance effort. | Critical self-hosted instances (especially Kubernetes) where performance and scalability are paramount. See our setup guide. |
| Sentry Integration | Uses the native n8n Sentry.io node to automatically capture and analyze workflow execution errors in detail. | Pros: Provides rich, contextual error reports with stack traces; aggregates similar errors. Cons: Focused on errors, not performance metrics. | Teams needing a developer-friendly tool for automated error capture and analysis. |
| Datadog / New Relic | Holistic Application Performance Management (APM) tools that can monitor n8n as part of a larger application stack. | Pros: Unified platform for logs, metrics, and traces. Cons: Expensive and complex to configure; may require custom instrumentation. | Large organizations wanting to integrate n8n into an existing, standardized APM ecosystem. |
How Do You Master n8n Troubleshooting and Core Monitoring?
Choosing the right tools is only half the battle. You also need to implement best practices for error management and performance optimization to build a truly resilient automation platform.
n8n Error Management & Performance
This section covers the essential concepts and strategies for effective n8n troubleshooting and performance tuning.
* n8n Error Handling: Don’t let workflows fail silently. Always use the ‘Error Trigger’ node to create dedicated workflows that handle failures. These can send notifications to Slack, create a ticket in Jira, or attempt a retry, turning unknown problems into managed incidents.
* n8n Logging Configuration: By default, n8n logs to the console. For production environments, configure your N8N_LOG_LEVEL and N8N_LOG_OUTPUT environment variables to write logs to a file or a service like Logstash/Fluentd. This centralizes your logs, making them searchable and analyzable.
* Addressing Silent Failures: Silent failures, where a workflow completes ‘successfully’ but produces an incorrect outcome, are the most dangerous. Implement data validation steps within your workflows and use monitoring tools to track key business metrics (e.g., ‘number of orders processed’). A sudden drop could indicate a silent failure that a simple health check would miss.
* n8n Performance Optimization: Use the metrics gathered from tools like Prometheus to identify bottlenecks. Are workflows taking longer to execute? Is the event queue growing? This data allows you to optimize workflows, scale your infrastructure, or adjust your concurrency settings before users are impacted. This is the essence of a proactive monitoring system.
No ready-made dashboard reads n8n’s queue counters
This is the finding worth the whole page, and it is easier to state than to discover: if you run queue mode, none of the published dashboards will show you your queue from the Prometheus metrics n8n exposes. Every option below is real and useful; none of them covers that.
| Dashboard | Datasource | Queue-mode job counters? |
|---|---|---|
| grafana.com 24474, n8n System Health Overview | Prometheus | No. Process and runtime only: CPU, event-loop latency, RSS and heap, garbage collection, file descriptors |
| grafana.com 24475, n8n Workflow & Execution Analytics | PostgreSQL | It has queue-depth panels, but they read n8n’s database schema, not n8n_scaling_mode_queue_jobs_*. It also needs a Postgres datasource wired to production |
| grafana.com 25518, n8n Workflow Traces | Tempo (OpenTelemetry) | No. Traces answer why one execution was slow, not how deep the queue is |
| n8n-io/n8n-observability, n8n’s own repo | Prometheus | No. It ships four dashboards, for form executions, poll triggers, the scheduler and webhook executions. None is queue mode |
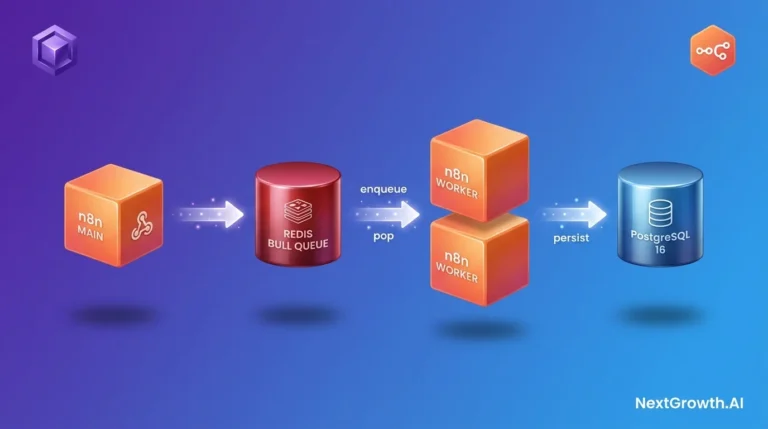
So for queue mode you build it. Four panels carry almost all of the value:
- Waiting against active. Plot
n8n_scaling_mode_queue_jobs_waitingandn8n_scaling_mode_queue_jobs_activeon one axis. Waiting climbing while active stays flat is the signature of a saturated pool, and reading it this way needs no knowledge of your slot ceiling. - Completed and failed rate.
rate()over the two counters. This is the one thing the Prometheus side gives you that reading Redis directly does not. - Estimated wait. Waiting divided by throughput, clamped so it survives zero throughput. Label the panel an estimate, because n8n does not measure enqueue-to-pickup at all.
- Your slot ceiling, written on the dashboard. No metric exposes worker concurrency, so put the number where a stale value is visible instead of hiding it in a template variable.
Two prerequisites, both easy to miss. The counters need
N8N_METRICS_INCLUDE_QUEUE_METRICS=true in addition to N8N_METRICS=true, and
only the main instance publishes them, never the workers. The full flag list and the
caveats behind each panel are in
n8n monitoring with Prometheus and Grafana; the
alerting side is in n8n error handling and alerts.
Dashboard contents verified 2026-09-03 against grafana.com and the
n8n-io/n8n-observability repository. Published dashboards change; re-check before you
conclude a panel is missing.
Frequently Asked Questions
What are the best tools for monitoring n8n?
The best tool depends on your needs. For basic insights, n8n’s built-in Executions Log is a good start. For powerful, self-hosted metrics and dashboards, the combination of n8n, Prometheus, and Grafana is the industry standard. For automated error tracking and reporting, Sentry is an excellent choice.
How do you handle n8n troubleshooting?
Effective n8n troubleshooting involves a multi-layered approach. First, use the built-in logs to inspect the input/output of failed nodes. Second, implement an ‘Error Trigger’ node to create dedicated error-handling workflows. Finally, use a tool like Sentry or Grafana to analyze error trends and performance bottlenecks over time.
Effective monitoring is only half the equation. When a workflow does fail, you need an alerting system that fires immediately. Our guide to n8n workflow error handling and alerts covers the three-layer defense: node-level retries, a global error trigger workflow, and centralized logging.
Why is continuous n8n monitoring important?
Continuous monitoring is critical because it allows you to detect and resolve issues before they impact your business operations. It helps prevent silent failures, ensures high availability with uptime monitoring, optimizes performance by identifying bottlenecks, and provides the observability needed to scale your automations confidently.