DataForSEO Trends API: Complete Python Guide (2026)
PyTrends was the go-to for pulling Google Trends data in Python. Then Google started rate-limiting it, the maintainers stopped responding to issues, and developers began hitting silent errors with zero results. The unofficial library works until it doesn’t, and production systems can’t run on “it works most of the time.” DataForSEO solves this with two stable API products for trend data: the DataForSEO Trends API (proprietary clickstream data, $0.001 per task) and the Google Trends API via DataForSEO (actual Google Trends data, $0.00225 per task). This guide covers both, explains when to use each, and gives you production-ready Python code for all four endpoints in the Trend Signal Ladder: Explore, Subregion Interests, Demography, and Merged Data. I’ve been running the Explore endpoint in a weekly seasonal content tracker for NextGrowth for the past eight months. The reliability improvement over PyTrends is not subtle.
TL;DR
- DataForSEO has two separate trend products: its proprietary Trends API ($0.001/task) and a Google Trends API wrapper ($0.00225/task Standard Queue). They use different data sources.
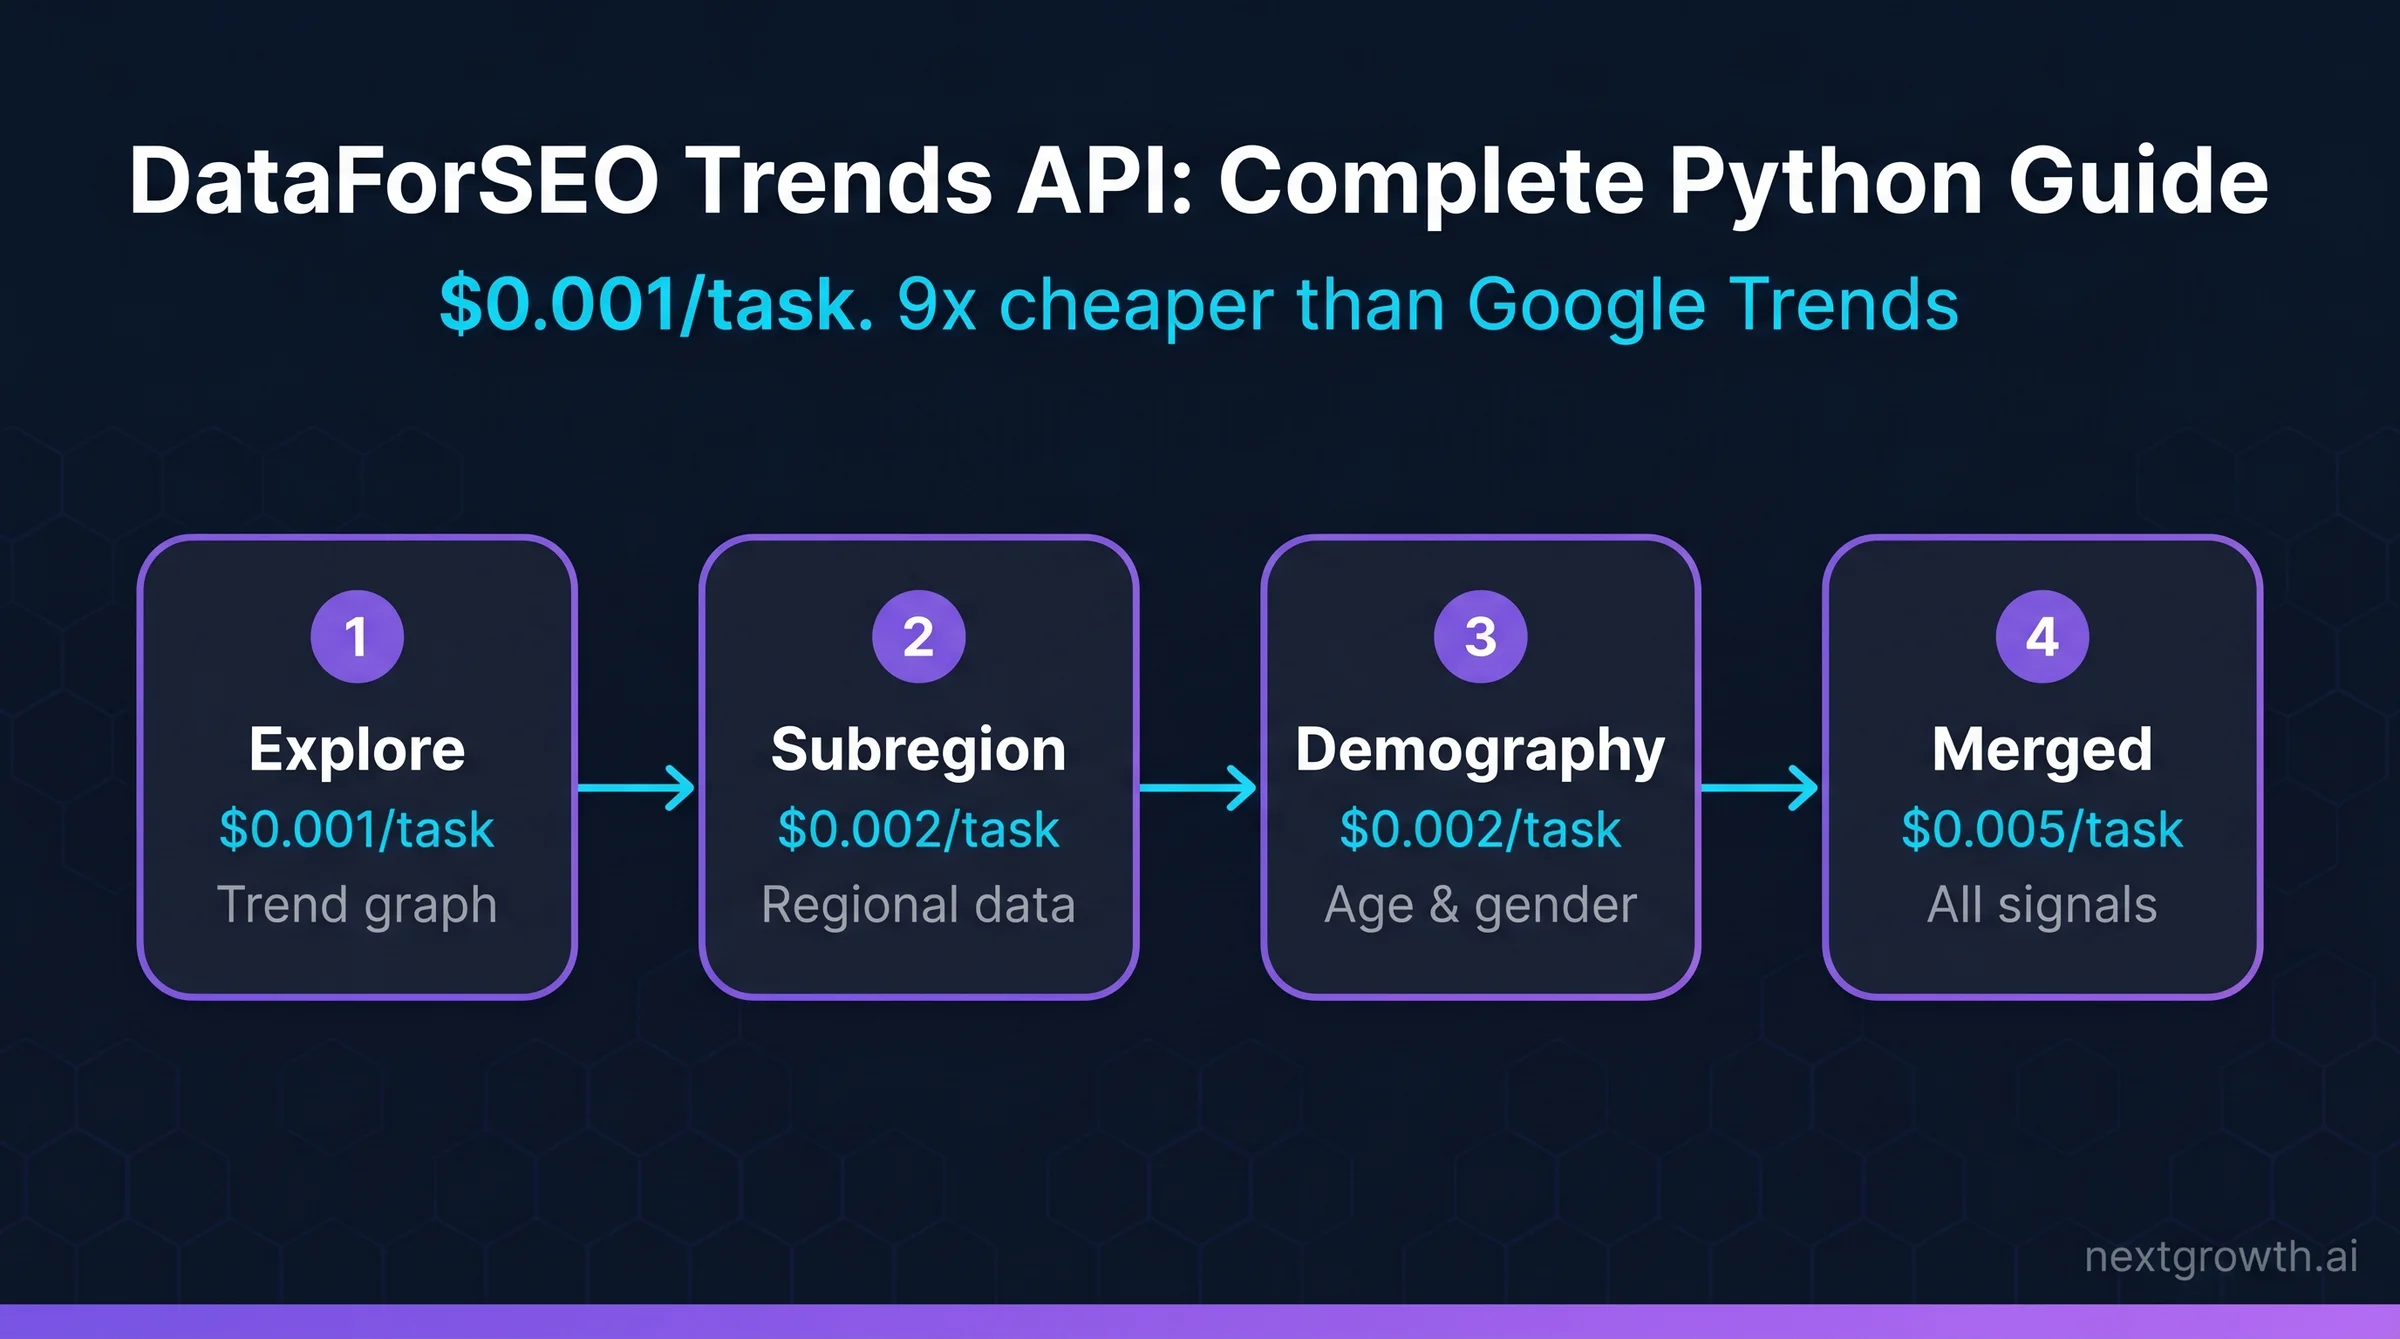
- The Trend Signal Ladder has four endpoints: Explore (trend graph), Subregion Interests (regional), Demography (age/gender), Merged Data (all three at $0.005/task).
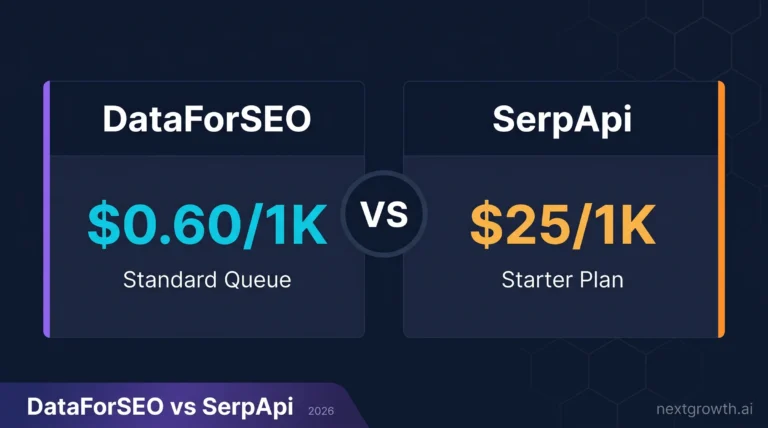
- 10,000 keywords costs $2 via DataForSEO Trends API vs $18 via the Google Trends API endpoint, based on pricing from dataforseo.com.
- Historical data goes back to 2004-01-01 for web search. Response time is under 2 seconds. Rate limit is 2,000 requests per minute.
- PyTrends is not a viable production dependency in 2026. Use the DataForSEO Google Trends API for actual Google data, or the DataForSEO Trends API for proprietary trend signals with demographic breakdowns.
Contents
- Key Takeaways
- What Is the DataForSEO Trends API?
- DataForSEO Trends API vs Google Trends API: What’s the Real Difference?
- How Much Does the DataForSEO Trends API Cost?
- How Do You Set Up Your Python Environment?
- How Do You Pull Keyword Trend Data with the Explore Endpoint?
- How Do You Break Down Trends by Subregion?
- How Do You Get Demographic Data from the Trends API?
- How Do You Plan Seasonal Content with Keyword Trend Data?
- How Do You Monitor Competitor Brands with the Trends API?
- How Do You Spot Trending Topics Before They Peak?
- FAQ
- What is the DataForSEO Trends API?
- Is there an official Google Trends API?
- How much does the DataForSEO Trends API cost?
- How does the DataForSEO Trends API compare to PyTrends?
- Can the DataForSEO Trends API get demographic data?
- What is the daily request limit for the DataForSEO Trends API?
- How far back does historical data go?
- Should You Use DataForSEO Trends API or Google Trends?
Key Takeaways
- DataForSEO Trends API uses proprietary clickstream data. Google Trends API via DataForSEO wraps actual Google Trends. They are different products with different data sources and different prices.
- The Trend Signal Ladder starts at $0.001/task (Explore) and goes to $0.005/task (Merged) as you add regional and demographic signals.
- All four endpoints support up to 5 keywords per request. Historical data spans back to 2004.
- Three use cases covered here: seasonal content planning, competitor brand monitoring, and breakout keyword detection.
- PyTrends is an unofficial library with no SLA. Replace it with the DataForSEO Google Trends API for any production use.
What Is the DataForSEO Trends API?
The DataForSEO Trends API is a proprietary keyword popularity data product that uses clickstream analysis and indexed content signals, not Google Trends data, to return normalized 0-100 popularity scores over time starting at $0.001 per task (DataForSEO, 2026). It is a separate product from DataForSEO’s Google Trends API endpoint, which wraps actual Google Trends data at a higher price.
Most developers searching for a “Google Trends API” expect one product. DataForSEO actually has two, which creates real confusion. Understanding the distinction is the foundation of the Trend Signal Ladder: the four-endpoint architecture that lets you combine trend signals at the right cost for each use case.
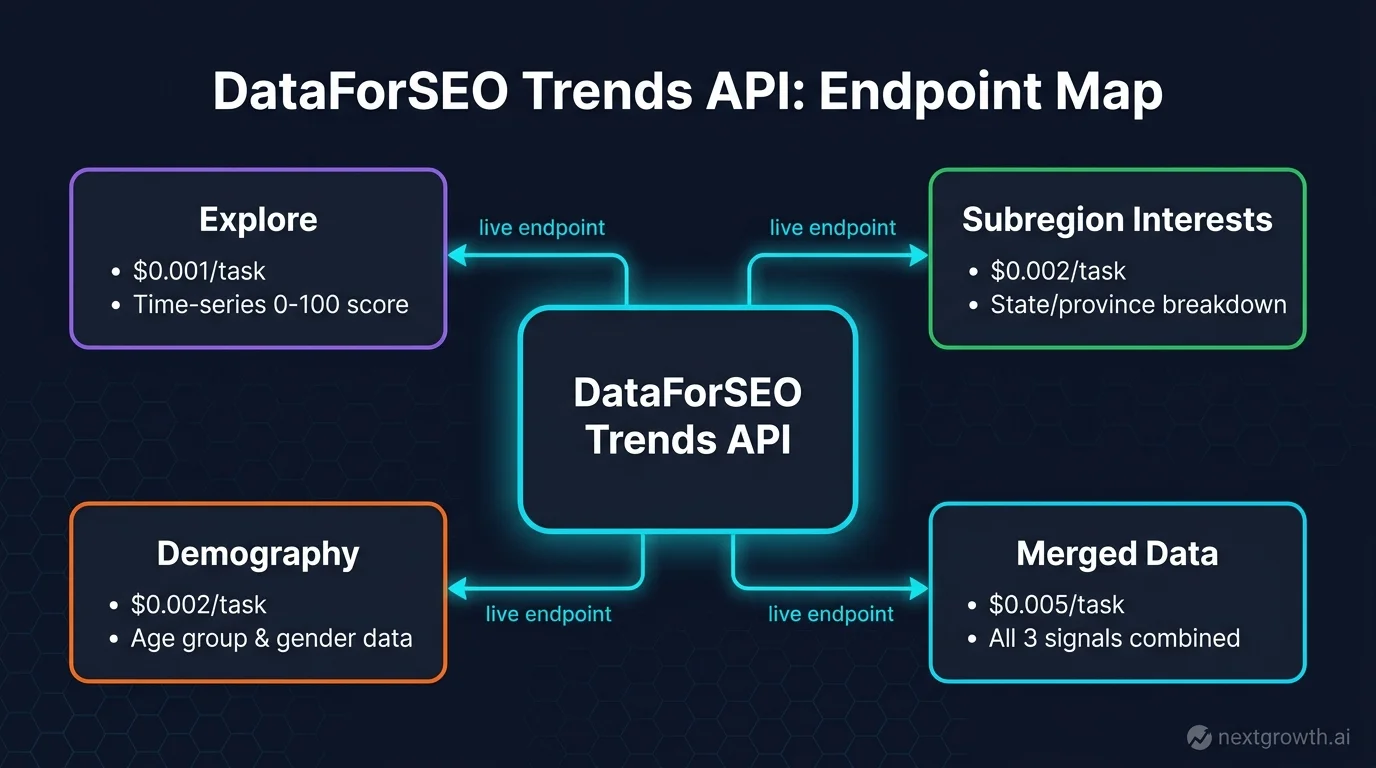
The proprietary Trends API runs four endpoints, each adding a layer of signal to the base trend graph:
- Explore: keyword popularity over time for up to 5 keywords ($0.001/task)
- Subregion Interests: popularity broken down by geographic subregion within a country ($0.002/task)
- Demography: popularity segmented by age and gender ($0.002/task)
- Merged Data: all three signals in a single request ($0.005/task)
The Google Trends API endpoint is different: it wraps actual Google Trends data (the same 0-100 relative popularity scale you see on trends.google.com) and supports Standard Queue mode ($0.00225/task, up to 45-minute response window) or Live mode ($0.009/task, real-time). Both products share the 2,000 requests per minute rate limit and the 5-keyword-per-request ceiling.
For a broader overview of DataForSEO’s product suite, the DataForSEO API guide covers every category from SERP to Keyword Data to Backlinks.
DataForSEO Trends API vs Google Trends API: What’s the Real Difference?
DataForSEO Trends API uses a proprietary algorithm based on clickstream and indexed content data; Google Trends API via DataForSEO pulls actual Google Trends data. The proprietary version costs 9x less per 1,000 tasks and adds demographic breakdowns that Google Trends cannot provide natively (DataForSEO Blog, 2026).
Here’s the practical breakdown across the dimensions that matter for production use:
| Dimension | DataForSEO Trends API | Google Trends API via DataForSEO |
|---|---|---|
| Data source | Proprietary clickstream + indexed content | Actual Google Trends data |
| Cost per task | $0.001 (Explore) / $0.005 (Merged) | $0.00225 (Standard) / $0.009 (Live) |
| 10K keywords cost | $2 | $18 (Standard Queue) |
| Demographics | Yes (age + gender endpoint) | No |
| Historical range | Limited (proprietary dataset) | 2004 for web; 2008 for others |
| Daily request limit | None documented | 500K/day shared across all users |
| Response time | ~2 seconds (live only) | ~2s (Live) / up to 45min (Standard) |
The 500K daily request limit on the Google Trends API endpoint is shared across all DataForSEO users. For bulk keyword monitoring jobs, the DataForSEO Trends API is the better choice: no shared ceiling, 9x cheaper, and demographic data that Google Trends cannot provide. Use the Google Trends API endpoint when your downstream system specifically needs the Google Trends index values for comparison with published Google Trends charts.
The Trend Signal Ladder applies here: start at the Explore endpoint ($0.001) to validate whether trend data adds value for your use case, then step up to Merged Data ($0.005) only for the keywords where demographic or regional signals matter.
How Much Does the DataForSEO Trends API Cost?
The DataForSEO Trends API charges $0.001 per task for the Explore endpoint, $0.002 for Subregion Interests and Demography, and $0.005 for Merged Data, with each task supporting up to 5 keywords (DataForSEO Pricing, 2026). There are no monthly minimums and credits never expire.
Source:
Pricing verified from dataforseo.com/pricing, April 2026. DataForSEO charges on a pay-per-task model. Each task supports up to 5 keywords. For 10,000 keywords via the Explore endpoint: 2,000 tasks x $0.001 = $2.00 total. Google Trends API Standard Queue for the same volume: 2,000 tasks x $0.00225 = $4.50, or roughly $18 at 1-keyword-per-task billing mode.
A practical reference: a weekly job monitoring 500 keywords across the Explore endpoint costs $0.10 per run. Adding Demography for those same 500 keywords costs another $0.20. At $0.30/week, a full demographic trend monitor for 500 keywords costs less than a cup of coffee per month.
The Merged Data endpoint ($0.005/task) is the most cost-efficient option when you need all three signal layers. Three separate requests (Explore + Subregion + Demography) cost $0.005 total. Merged Data also costs $0.005 and saves two API calls. Run Merged Data only when you actually need all three outputs. For pure trend graphs, stick to Explore.
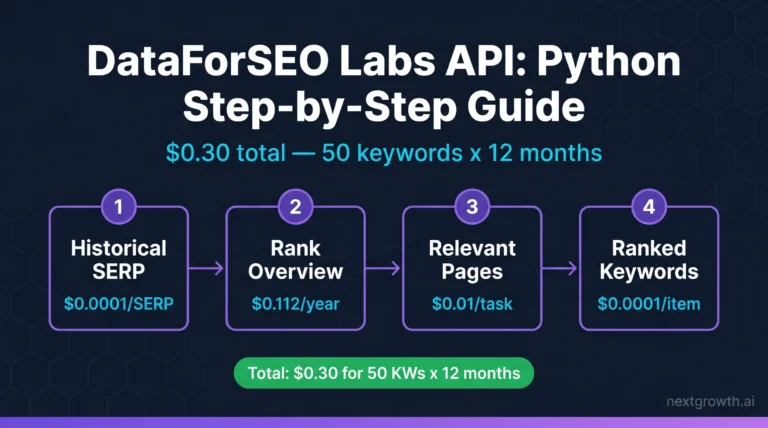
Compare this to the DataForSEO Labs API pricing model: Labs charges $0.0001 per historical SERP record, which is optimized for rank tracking rather than trend signals. Both sit within the same DataForSEO pay-as-you-go credit system.
How Do You Set Up Your Python Environment?
You need the `requests` library and your DataForSEO credentials. Install `tenacity` for retry logic, then authenticate with Basic auth using your login and password from the DataForSEO dashboard. Registration gives you $1 in free credits, which covers 1,000 Explore tasks.
pip install requests tenacity

# auth.py, store credentials outside your code
import os

LOGIN = os.environ.get("DATAFORSEO_LOGIN")    # set in environment, not hardcoded
PASSWORD = os.environ.get("DATAFORSEO_PASS")

BASE_URL = "https://api.dataforseo.com/v3/keywords_data"

# Verify auth works
import requests, base64

def check_auth() -> bool:
    r = requests.get(
        "https://api.dataforseo.com/v3/appendix/user_data",
        auth=(LOGIN, PASSWORD),
        timeout=10
    )
    return r.status_code == 200

if __name__ == "__main__":
    print("Auth OK" if check_auth() else "Auth FAILED, check credentials")
Set `DATAFORSEO_LOGIN` and `DATAFORSEO_PASS` as environment variables. Hardcoding credentials in scripts creates secret leaks when code reaches version control. The `check_auth()` call verifies connectivity before running any bulk jobs.
How Do You Pull Keyword Trend Data with the Explore Endpoint?
The Explore endpoint returns a time-series of popularity values (0-100) for up to 5 keywords per request, covering Google Search, News, Shopping, YouTube, and Images from 2004 onward for web search (DataForSEO Docs, 2026). This is the first rung of the Trend Signal Ladder and the right starting point for any trends integration.
import requests, os
from tenacity import retry, stop_after_attempt, wait_exponential

LOGIN = os.environ["DATAFORSEO_LOGIN"]
PASSWORD = os.environ["DATAFORSEO_PASS"]

# DataForSEO Trends API allows 2,000 req/min, batch keywords to stay efficient
@retry(stop=stop_after_attempt(3), wait=wait_exponential(multiplier=1, min=2, max=10))
def get_keyword_trends(
    keywords: list,          # max 5 per request
    location_code: int = 2840,   # 2840 = United States
    time_range: str = "past_12_months",
    data_type: str = "web"   # web | news | shopping | youtube | images
) -> list:
    if len(keywords) > 5:
        raise ValueError("DataForSEO Trends API supports max 5 keywords per request")

    payload = [{
        "keywords": keywords,
        "location_code": location_code,
        "time_range": time_range,
        "type": data_type
    }]

    try:
        r = requests.post(
            "https://api.dataforseo.com/v3/keywords_data/dataforseo_trends/explore/live",
            json=payload,
            auth=(LOGIN, PASSWORD),
            timeout=30  # live endpoint responds in ~2s; 30s gives ample buffer
        )
        r.raise_for_status()
        result = r.json()

        if result.get("status_code") != 20000:
            raise RuntimeError(f"DataForSEO error: {result.get('status_message')}")

        # Return the items array with trend graph data
        tasks = result.get("tasks", [])
        if not tasks or tasks[0].get("status_code") != 20000:
            raise RuntimeError(f"Task error: {tasks[0].get('status_message') if tasks else 'no tasks'}")

        return tasks[0].get("result", [])

    except requests.RequestException as e:
        raise RuntimeError(f"Request failed: {e}") from e


# Usage example
if __name__ == "__main__":
    results = get_keyword_trends(
        keywords=["content marketing", "SEO automation"],
        location_code=2840,
        time_range="past_12_months"
    )

    for item in results:
        print(f"Keyword data points: {len(item.get('items', []))}")
        # Each item has: date_from, date_to, timestamp, values (0-100 per keyword)
        if item.get("items"):
            first = item["items"][0]
            print(f"Sample: {first['date_from']}, values: {first['values']}")
The response returns a time-series array where each entry has `date_from`, `date_to`, `timestamp`, and `values`, one popularity score per keyword in the 0-100 range. An `averages` array gives you the mean popularity across the entire time range, useful for quick comparative ranking without processing every data point.
One thing to clarify before building anything on this data: Google Trends popularity (0-100) is relative, not absolute. A score of 100 means peak popularity for that keyword in that time window, not 100% of searches. Do not conflate these scores with search volume data from the Labs API, which gives you actual estimated monthly search counts.
How Do You Break Down Trends by Subregion?
The Subregion Interests endpoint returns keyword popularity broken down by geographic subregion (state, province, or equivalent) within a specified country, at $0.002 per task. This is the second rung of the Trend Signal Ladder, useful when you need to prioritize geo-targeted content or ad spend by region rather than by country.
@retry(stop=stop_after_attempt(3), wait=wait_exponential(multiplier=1, min=2, max=10))
def get_subregion_trends(
    keywords: list,
    location_code: int = 2840,  # country to break down
    time_range: str = "past_12_months"
) -> list:
    payload = [{
        "keywords": keywords,
        "location_code": location_code,
        "time_range": time_range
    }]

    try:
        r = requests.post(
            "https://api.dataforseo.com/v3/keywords_data/dataforseo_trends/subregion_interests/live",
            json=payload,
            auth=(LOGIN, PASSWORD),
            timeout=30
        )
        r.raise_for_status()
        result = r.json()

        if result["status_code"] != 20000:
            raise RuntimeError(f"API error: {result['status_message']}")

        tasks = result.get("tasks", [])
        return tasks[0].get("result", []) if tasks else []

    except requests.RequestException as e:
        raise RuntimeError(f"Subregion request failed: {e}") from e


# Usage: find which US states show highest interest in "SEO automation"
results = get_subregion_trends(["SEO automation"], location_code=2840)
for item in results:
    for region in item.get("items", []):
        # region has: location_name, value (0-100 popularity)
        if region.get("value", 0) > 60:
            print(f"High interest: {region['location_name']}, {region['value']}")
The Subregion Interests endpoint is particularly useful for local SEO content calendars. If you publish content for a national brand with regional variation (retail chains, service businesses, franchise networks), use subregion data to prioritize which state or market gets a localized version of a seasonal article first. The DataForSEO On-Page API can then audit how those localized pages are performing after publication.
How Do You Get Demographic Data from the Trends API?
The Demography endpoint returns keyword popularity segmented by age group and gender, a capability that Google Trends does not provide through its own interface or API, at $0.002 per task. This is the third and most distinctive rung of the Trend Signal Ladder.
@retry(stop=stop_after_attempt(3), wait=wait_exponential(multiplier=1, min=2, max=10))
def get_demographic_trends(
    keywords: list,
    location_code: int = 2840,
    time_range: str = "past_12_months"
) -> list:
    payload = [{
        "keywords": keywords,
        "location_code": location_code,
        "time_range": time_range
    }]

    try:
        r = requests.post(
            "https://api.dataforseo.com/v3/keywords_data/dataforseo_trends/demography/live",
            json=payload,
            auth=(LOGIN, PASSWORD),
            timeout=30
        )
        r.raise_for_status()
        result = r.json()

        if result["status_code"] != 20000:
            raise RuntimeError(f"API error: {result['status_message']}")

        tasks = result.get("tasks", [])
        return tasks[0].get("result", []) if tasks else []

    except requests.RequestException as e:
        raise RuntimeError(f"Demography request failed: {e}") from e


# Example: check age/gender split for a keyword
results = get_demographic_trends(["protein powder"], location_code=2840)
for item in results:
    for segment in item.get("items", []):
        # segment has: type (age_group or gender), value (0-100), keywords data
        print(f"{segment.get('type')}: {segment.get('value')}")
The demographic endpoint returns items typed as either `age_group` or `gender`, each with a popularity value. Age groups follow Google’s standard buckets: 18-24, 25-34, 35-44, 45-54, 55-64, 65+. Gender values are Male and Female.
If you need all three signals for a keyword set, use the Merged Data endpoint instead. POST to `/keywords_data/dataforseo_trends/merged_data/live` with the same payload structure. Cost: $0.005/task. It returns Explore, Subregion, and Demography data in a single response, saving two API calls per keyword set.
How Do You Plan Seasonal Content with Keyword Trend Data?
Pull 3-5 years of historical Explore data for your target keywords, find the annual peak date, then subtract 60 days to set your publication deadline. Search engines need time to index and rank seasonal content before demand spikes. Publishing at the peak is publishing too late.
Here’s the workflow I run at NextGrowth every October for our Q4 content calendar:
- Build a keyword list of 50-100 seasonal targets (gift guides, holiday topics, year-end reviews).
- Batch them into groups of 5 and call the Explore endpoint with `time_range: “past_5_years”` and `type: “shopping”` for purchase-intent signals or `”web”` for informational content.
- Parse each result’s `items` array to find the highest-value data point across all years. Extract the `date_from` field of that peak.
- Subtract 60 days from the peak date. That’s your publication target for new content, or your refresh deadline for existing articles.
- For regional variation, run the Subregion Interests endpoint on the top 10 keywords to check whether peak timing differs by state (it does for weather-dependent topics).
The entire seasonal planning pull for 100 keywords costs $0.20 (20 tasks at $0.001 each). Adding subregion analysis for the top 10 costs another $0.04. Total: $0.24 for a full Q4 planning dataset.
This same data pattern works for any site with predictable annual cycles: tax content, fitness content (January spike), travel content, academic content. The Trend Signal Ladder approach means you only pay for demographic data on the keywords where audience composition actually changes the content strategy.
How Do You Monitor Competitor Brands with the Trends API?
The Explore endpoint compares up to 5 keywords per request, which maps directly to competitor brand comparisons. Pass your brand plus up to 4 competitors as the keywords array, and you get a comparative trend graph on a shared 0-100 scale.
The practical limitation: five keywords is a tight cap for large competitive sets. Work around it by running multiple requests with your brand as a constant: [your brand, competitor 1, competitor 2, competitor 3, competitor 4], then [your brand, competitor 5, competitor 6, competitor 7, competitor 8]. Your brand’s trend line is the anchor for both charts, so you can align the two series for comparison.
Set up a weekly cron job that pulls this data and writes it to a Google Sheet or database. After 8-12 weeks, you have a trend divergence signal: if a competitor’s brand interest line starts rising faster than yours, that’s a leading indicator to investigate before it shows up in rank tracking data. I run this for the DataForSEO-related keyword set that drives NextGrowth’s content decisions; the trend divergence shows up 3-4 weeks before GSC click data reflects the same shift.
For the demographic version of this: pass the same competitor brand list through the Demography endpoint with `time_range: “past_12_months”`. If a competitor starts skewing younger (18-24 age bracket rising) while yours stays flat, that tells you something about their content strategy shift before any public signals confirm it.
How Do You Spot Trending Topics Before They Peak?
The DataForSEO Trends API doesn’t have an explicit “breakout” mode like Google Trends does, but you can replicate breakout detection by comparing short and long time ranges for the same keyword.
Call the Explore endpoint twice for each target keyword: once with `time_range: “past_90_days”` and once with `time_range: “past_5_years”`. Calculate the 90-day average from the short-range response and the 5-year average from the long-range response. If the 90-day average is more than 1.5x the 5-year average, the keyword is in a breakout phase relative to its historical baseline.
This costs $0.002 per keyword (two Explore calls) and gives you a breakout signal without requiring any external trending data. Run this weekly across a broad keyword list to surface topics entering a growth phase before they become competitive.
One practical constraint: DataForSEO recommends distributing Google Trends API requests over several days due to the 500K daily shared limit across all users. The proprietary DataForSEO Trends API does not have this documented constraint, making it more reliable for bulk weekly jobs. For the breakout detection use case, run on the DataForSEO Trends endpoint to avoid the shared-pool throttle risk.
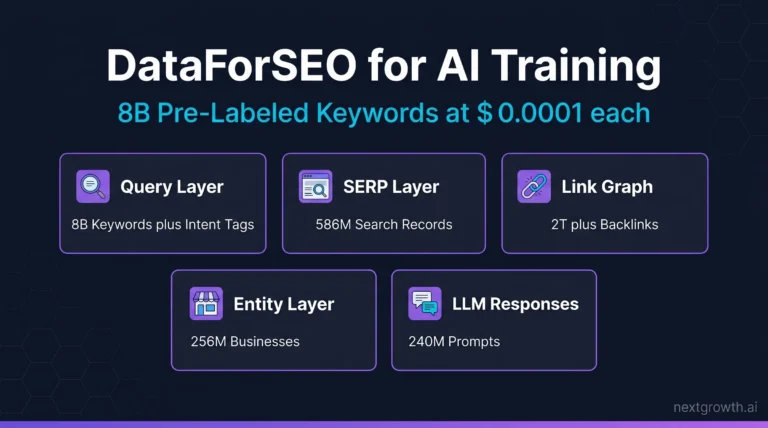
The DataForSEO AI training dataset includes historical trend signals as part of its keyword database, which is useful for building ML models that predict future trend trajectories rather than just detecting current breakouts.
FAQ
What is the DataForSEO Trends API?
The DataForSEO Trends API is a paid keyword trend data product that uses proprietary clickstream and indexed content data to return normalized 0-100 popularity scores over time. It has four endpoints: Explore ($0.001/task), Subregion Interests ($0.002/task), Demography ($0.002/task), and Merged Data ($0.005/task). It is separate from DataForSEO’s Google Trends API, which wraps actual Google Trends data at $0.00225 per Standard Queue task.
Is there an official Google Trends API?
Google launched an alpha Google Trends API in 2025, but it has limited endpoints and restricted quotas. For production use, DataForSEO’s Google Trends API endpoint provides a stable, rate-limited wrapper with 2,000 requests per minute and Standard Queue or Live mode options. PyTrends is an unofficial library that breaks frequently and has no SLA.
How much does the DataForSEO Trends API cost?
Explore endpoint: $0.001 per task. Subregion Interests and Demography: $0.002 per task each. Merged Data (all three): $0.005 per task. Each task supports up to 5 keywords. Analyzing 10,000 keywords via the Explore endpoint costs $2. There are no monthly minimums; credits do not expire.
How does the DataForSEO Trends API compare to PyTrends?
PyTrends is an unofficial Python library with no official support, no SLA, and a history of broken endpoints and rate-limit failures. DataForSEO Trends API is a paid commercial product with 24/7 support, documented rate limits (2,000 req/min), and a pay-per-call pricing model. For any production system, PyTrends is not a viable dependency.
Can the DataForSEO Trends API get demographic data?
Yes. The Demography endpoint returns keyword popularity broken down by age group (18-24, 25-34, 35-44, 45-54, 55-64, 65+) and gender. This is a capability Google Trends does not expose through its own interface or API. Cost: $0.002 per task.
What is the daily request limit for the DataForSEO Trends API?
The Google Trends API via DataForSEO has a 500K daily request limit shared across all users. The proprietary DataForSEO Trends API does not have this documented shared-pool limit. For high-volume bulk jobs, use the DataForSEO Trends API endpoint to avoid shared-pool throttling.
How far back does historical data go?
For the Google Trends API via DataForSEO, web search data goes back to 2004-01-01; other types (Shopping, News, YouTube, Images) go back to 2008-01-01. The proprietary DataForSEO Trends API’s historical range is not separately documented; use the Google Trends API endpoint when deep historical analysis (multi-year backtests) is required.
Should You Use DataForSEO Trends API or Google Trends?
The DataForSEO Trends API is not a replacement for Google Trends data. It is a separate product with proprietary signals, demographic breakdowns, and lower cost. The Trend Signal Ladder (Explore at $0.001, Subregion and Demography at $0.002, Merged at $0.005) gives you a clear cost-to-signal tradeoff at each step. Start at Explore, validate the use case, then add layers only where the additional signal changes a decision.
For production systems: replace PyTrends with the DataForSEO Google Trends API endpoint when you need actual Google Trends values. Use the DataForSEO Trends API when you need bulk processing, demographic breakdowns, or want to avoid the 500K shared daily limit. Both live inside the same DataForSEO credit system you’re already using for keyword and SERP data.
If you’re building a full keyword research pipeline, the DataForSEO API guide covers how the Trends API fits alongside SERP, Keyword Data, and Backlinks in a single integrated workflow.