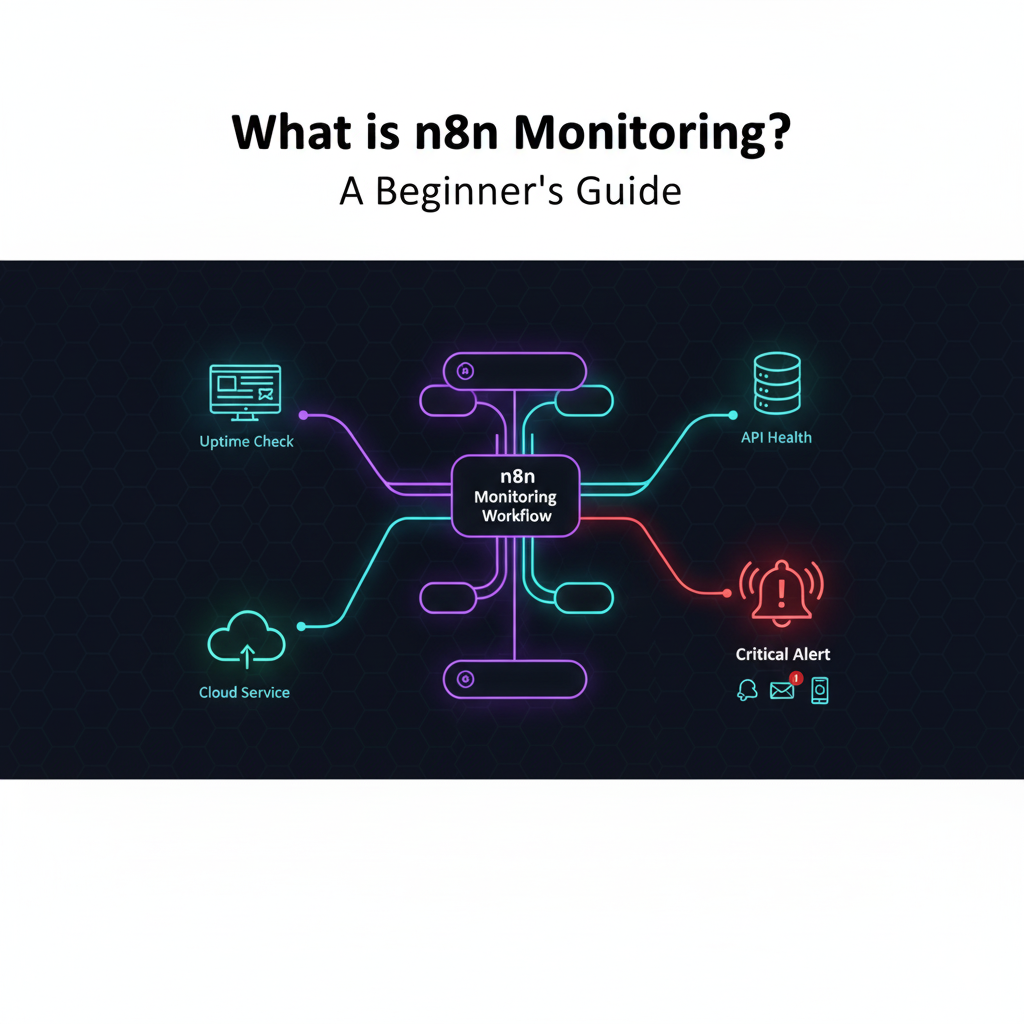
What is n8n Monitoring? A Beginner’s Guide
If you’re exploring the world of automation, you’ve likely heard of n8n. But when the term ‘n8n monitoring’ comes up, the picture can get a little blurry. Is it a built-in feature? Is it a standalone monitoring system? The simple answer is both yes and no, and this distinction is crucial for new users. Many guides assume you already know the lingo, diving straight into complex code and configurations.
This guide is different. We’re starting from square one to provide a clear, high-level overview of what n8n monitoring truly is. We’ll explain its core purpose, break down the two primary types of monitoring you can achieve, and—most importantly—clarify n8n’s role as a powerful, customizable automation tool for monitoring, not an out-of-the-box enterprise solution. For more details, see our n8n monitoring tools. By the end, you’ll understand its capabilities, its limitations, and how to think about it strategically.
Contents
- What is n8n Monitoring?
- Why n8n Monitoring Matters
- The Two Sides of n8n Monitoring: Internal vs. External
- Common n8n Monitoring Scenarios
- How to Get Started with n8n Monitoring
- What to Monitor First: A Priority Checklist
- Setting the Right Expectations: n8n’s Role in Your Monitoring Strategy
- Frequently Asked Questions
TL;DR
- n8n monitoring means using n8n workflows to check on systems, APIs, and servers — and alert you when something goes wrong.
- There are two sides: monitoring your n8n instance (CPU, memory, failed runs) and using n8n to monitor external services (websites, APIs, databases).
- n8n is not a pre-built monitoring product — it’s a flexible automation engine you configure yourself.
- For a deep-explore setting up dashboards with Prometheus and Grafana, see our n8n monitoring with Prometheus and Grafana guide.
What is n8n Monitoring?
n8n monitoring is the practice of building automated workflows inside n8n that periodically check the health, status, or performance of a system — and take a specific action when something needs attention. That action might be sending a Slack alert, logging data to a spreadsheet, restarting a service, or opening a support ticket. In short, n8n monitoring is “if something breaks or looks wrong, do this” — automated.
fundamentally, n8n is a workflow automation tool. It connects different applications and services through nodes to perform a series of actions automatically. According to Codecademy, n8n is a workflow automation platform that allows users to build complex, multi-app integrations.
Think of n8n as a box of powerful building blocks. You aren’t buying a pre-built monitoring dashboard; you’re getting the tools to build a custom one that does exactly what you need.
What is n8n Monitoring, Really?
To put it simply, n8n monitoring is a question of application. It’s about designing workflows that periodically check the health, status, or data of a service and then take a specific action — like sending a Slack notification, creating a Trello card, or logging data to a Google Sheet. This is how n8n is used for monitoring: as a flexible, code-driven engine to create advanced, tailored monitoring solutions that reflect a premium approach to system health, without being locked into a specific platform.
Core n8n Monitoring Capabilities for Beginners
The power of n8n lies in its flexibility. Hostinger states that n8n can connect to any API using its HTTP Request node, enabling extensive monitoring capabilities. For beginners, the key capabilities include:
- Scheduled Checks: Run a workflow every minute, hour, or day to check a system’s status.
- Conditional Logic: Use ‘IF’ nodes to perform different actions based on the results of a check (e.g., if a website is down, send an alert; if it’s up, do nothing).
- Multi-Channel Notifications: Send alerts to the platforms you actually use, like Slack, Discord, Telegram, email, or SMS.
- Data Logging: Record uptime, downtime, and performance metrics over time in a database or spreadsheet for later analysis.
Why n8n Monitoring Matters
If you self-host n8n — whether on a VPS, a home server, or inside Docker — your automation runs 24/7 without anyone watching over it. Workflows fire at 3 AM. API calls happen while you sleep. Webhooks process data with no human in the loop. That’s the whole point of automation. But it also means problems can silently pile up before you notice anything is wrong.
Without monitoring, a single failed workflow might trigger hundreds of retry errors over a weekend. For more details, see our n8n workflow error alerts. A memory leak might bring your server to a crawl. An expired API token might silently break a critical business process. You only find out when a client complains or revenue stops flowing.
Monitoring closes this visibility gap. It gives you early warning when things drift outside normal behavior — before they become real outages. For anyone running n8n in production (even at small scale), monitoring is not optional; it’s essential infrastructure.
If you’re new to self-hosting, our guide on how to self-host n8n covers the foundational setup before you add monitoring on top.
The Two Sides of n8n Monitoring: Internal vs. External
To truly grasp n8n monitoring, it’s essential to separate it into two distinct categories: monitoring your n8n instance itself (internal) and monitoring other, external services (external).
| Aspect | Internal Monitoring (Your n8n Instance) | External Monitoring (Other Services) |
|---|---|---|
| Primary Focus | The health and performance of the n8n application itself. | The health and status of other websites, APIs, and applications critical to your business. |
| Core Responsibility | Ensuring your automation engine is running reliably, which is crucial when self-hosting. | Using n8n as a central hub to watch over your entire digital ecosystem. |
| Example Use Cases | Checking for failed workflow executions. Monitoring server CPU, memory, and disk space. | Website uptime and content change checks. API health and response time monitoring. |
Integrating with General Monitoring Tools
While n8n can act as a standalone monitoring tool for many tasks, it can also integrate with a vast ecosystem of professional network monitoring tools. n8n can act as the ‘glue’ between services. For instance, if your Zabbix network monitoring system detects an issue, it can trigger an n8n workflow to create a detailed ticket in Jira and notify the on-call engineer via Slack. This flexibility allows n8n to enhance existing infrastructure monitoring setups, from server monitoring to cloud monitoring and even IoT monitoring.
Common n8n Monitoring Scenarios
Knowing that monitoring is possible is one thing — knowing what to actually monitor is another. Here are the most common scenarios n8n users set up, especially when running self-hosted instances.
1. Failed Workflow Executions
This is the most important thing to monitor and the easiest to start with. n8n logs every workflow execution as either “success” or “error.” If a critical workflow fails — say, your nightly invoice sync or a lead enrichment pipeline — you want to know immediately, not hours later when someone notices the missing data.
You can build a meta-monitoring workflow in n8n: a scheduled workflow that queries the n8n execution log API, filters for recent errors, and sends you a daily digest (or an immediate alert for workflows tagged as critical). This is one of the first things any serious n8n user should set up.
2. Memory and CPU Usage
n8n can be memory-hungry, especially when processing large datasets or running many concurrent workflows. If your server runs out of memory, n8n will either slow to a crawl or crash entirely — and your automations stop silently.
A simple monitoring workflow can run a shell command via n8n’s Execute Command node to check free memory and CPU load every few minutes. If memory drops below a safe threshold (say, less than 20% free), you get a Slack ping before the system becomes unstable. On Linux servers, this typically means checking /proc/meminfo or using the free -m command output.
3. Disk Space
n8n stores execution logs and workflow data in a database (SQLite by default, or Postgres for larger installs). If the disk fills up, n8n stops writing logs — and then stops functioning altogether. Disk space is easy to forget about until it’s suddenly critical.
A scheduled workflow can check disk usage via the Execute Command node (df -h on Linux) and alert you when usage crosses 80% or 90% capacity. Pair this with automated log-pruning tasks to keep your disk healthy long-term.
4. Website and API Uptime
This is n8n’s most popular external monitoring use case. Set up a Cron-triggered workflow that fires an HTTP Request to your website or API endpoint every 5 minutes. Check the response status code: if it’s anything other than 200, trigger an alert. You can layer in response time checks — if a usually-fast API starts taking more than 3 seconds to respond, that’s a signal worth knowing about even before it fully breaks.
5. Third-Party Service Health
Your workflows depend on external services: payment processors, CRMs, data APIs, email providers. Any one of these can have outages or degrade in performance. n8n can periodically query their public status pages (most major services expose a status API) and notify you if a dependency is experiencing an incident — before your own workflows start failing because of it.
How to Get Started with n8n Monitoring
Starting from scratch with monitoring feels overwhelming, but the key is to begin with one workflow and build from there. Here’s a practical sequence for beginners.
Step 1: Monitor Failed Executions First
Before anything else, set up execution failure alerts. This gives you immediate safety coverage for workflows you’ve already built. In n8n, you can use the “Error Workflow” setting on any workflow — this triggers a separate workflow whenever the original fails. Build one simple error-handler workflow that sends the error message, workflow name, and timestamp to Slack or email. Assign it to all your critical workflows. This takes about 15 minutes and protects everything you’ve already built.
Step 2: Add a Server Health Check
Next, create a scheduled workflow that runs every 10–15 minutes to check your server’s CPU, memory, and disk. Use n8n’s Execute Command node to run system commands and parse the output. Route the result through an IF node: if all metrics are within normal range, do nothing. If any metric exceeds your threshold, send an alert. Keep the alert message specific — “Disk at 87% on n8n server” is far more useful than “Something is wrong.”
Step 3: Set Up Uptime Monitoring for External Services
Once internal monitoring is in place, extend outward. Pick the two or three external services most critical to your business and build uptime-check workflows for each. Start simple: HTTP Request to check status code, then alert if not 200. Once those are running reliably, you can add response time checks, content verification (does the page still contain expected text?), or SSL certificate expiry warnings.
Step 4: Go Deeper with Prometheus and Grafana
For teams who want real dashboards with historical trends, alerting rules, and production-grade observability, the next step is integrating n8n with Prometheus (for metrics collection) and Grafana (for visualization). n8n exposes a /metrics endpoint that Prometheus can scrape, giving you time-series data on workflow execution counts, error rates, queue depth, and more. Our detailed guide walks you through the complete setup: n8n Monitoring with Prometheus and Grafana.
What to Monitor First: A Priority Checklist
If you’re not sure where to start, use this priority order. It’s designed to get you the most coverage for the least effort.
- Workflow error handler — Set up one global error-handler workflow and assign it to all critical workflows. Highest ROI, fastest to build.
- n8n process uptime — Confirm n8n itself is running. A simple external ping to your n8n URL every 5 minutes catches crashes immediately.
- Disk space — Check every 15 minutes. Alert at 80%, act urgently at 90%.
- Memory usage — Especially important if you run large data-processing workflows. Alert when free memory drops below 20%.
- CPU load — Sustained high CPU often signals a workflow stuck in a loop or an external API hammering your instance.
- Critical external APIs — Any third-party service your business-critical workflows depend on.
- Response time trends — Not just “is it up?” but “is it getting slower?” Gradual degradation often precedes outages.
Setting the Right Expectations: n8n’s Role in Your Monitoring Strategy
Understanding n8n’s strengths is key to using it effectively. It’s a powerful automation framework, but it’s not a specialized, one-click monitoring platform. This distinction is where many beginners get confused.
Understanding n8n Monitoring Limitations
While incredibly versatile, there are some inherent n8n monitoring limitations. The primary one is that it’s not a pre-built product. You have to design, build, and maintain your monitoring workflows yourself. If you are self-hosting, the reliability of your monitoring depends entirely on the reliability of your n8n instance. These n8n self-hosting monitoring responsibilities mean you are in charge of updates, security, and ensuring the server itself has high uptime. The n8n documentation highlights that its open-source nature fosters a large and active community, providing support and resources.
n8n vs. Dedicated Monitoring Tools: A Critical Distinction
| Feature | n8n (Automation Framework) | Dedicated Monitoring Tools |
|---|---|---|
| Approach | Build-it-Yourself: Provides the building blocks to create custom monitoring logic from scratch. | Ready-to-Deploy: Offers a pre-built, comprehensive solution out of the box. |
| Key Strength | Unparalleled flexibility and customization for any API-driven task. | Advanced analytics, anomaly detection, and sophisticated dashboards. |
| Cost Model | Free and open-source (if self-hosted). Paid cloud plans are also available. | Typically subscription-based, often with a significant price tag for enterprise features. |
| Ideal User | Users who need complete control and want to integrate monitoring with custom response actions. | Teams needing a ready-to-deploy, enterprise-grade solution with minimal setup. |
Frequently Asked Questions
What is n8n monitoring?
n8n monitoring is the practice of using n8n’s workflow automation platform to build custom checks and alerts. Instead of being a single feature, it’s a method where you create workflows to track the status, health, and data of internal systems (like n8n itself) or external services (like websites, APIs, and servers).
Can n8n be used for website uptime monitoring?
Yes, absolutely. This is one of the most common use cases. You can set up a simple workflow with an HTTP Request node to check your website at a set interval (e.g., every 5 minutes). If the site doesn’t respond with a success status code, the workflow can trigger an immediate notification to you via Slack, email, or another service.
Is n8n a replacement for dedicated monitoring tools like Zabbix or Datadog?
No, not directly. n8n should be seen as a flexible and customizable alternative or supplement, not a one-to-one replacement. Dedicated tools offer advanced, out-of-the-box features for analytics and visualization. n8n provides the building blocks to create highly specific and custom monitoring logic that dedicated tools may not support.
What are the limitations of using n8n for monitoring?
The main limitations are that you must build and maintain the monitoring workflows yourself. If you self-host n8n, the reliability of your monitoring is tied to the uptime of your n8n server. It also lacks the sophisticated, built-in dashboards and anomaly detection algorithms found in specialized, enterprise-grade monitoring platforms.
How do I monitor n8n with Prometheus and Grafana?
n8n exposes a /metrics endpoint compatible with Prometheus. You configure Prometheus to scrape that endpoint on a regular interval, then connect Grafana to Prometheus as a data source to build dashboards showing execution rates, error counts, queue depth, and more. For a full step-by-step walkthrough, see our guide: n8n Monitoring with Prometheus and Grafana.
What should I monitor first if I’m new to n8n?
Start with workflow execution failures — set up an error-handler workflow that alerts you immediately when a critical workflow fails. This protects all your existing automation with minimal effort. From there, add server resource checks (memory, disk, CPU) and then external API uptime checks for services your workflows depend on.