n8n Queue Mode: Production Setup Guide (7x Faster)
Your automations are humming along. Then a busy day hits: tests lag, webhook calls stack up, one CPU pegs at 100%, and everything feels slow. This isn’t just an inconvenience—it’s a production failure. When your n8n instance becomes the bottleneck, webhook timeouts cascade into lost leads, failed integrations, and manual cleanup work that defeats the purpose of automation. The cost of inaction compounds: every hour spent firefighting performance issues is an hour not spent building value.
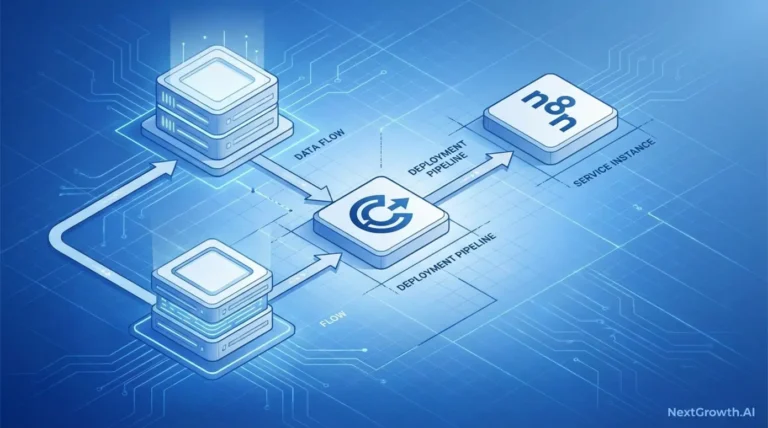
Coolify provides an easy way to manage your n8n deployment with built-in SSL and container orchestration.
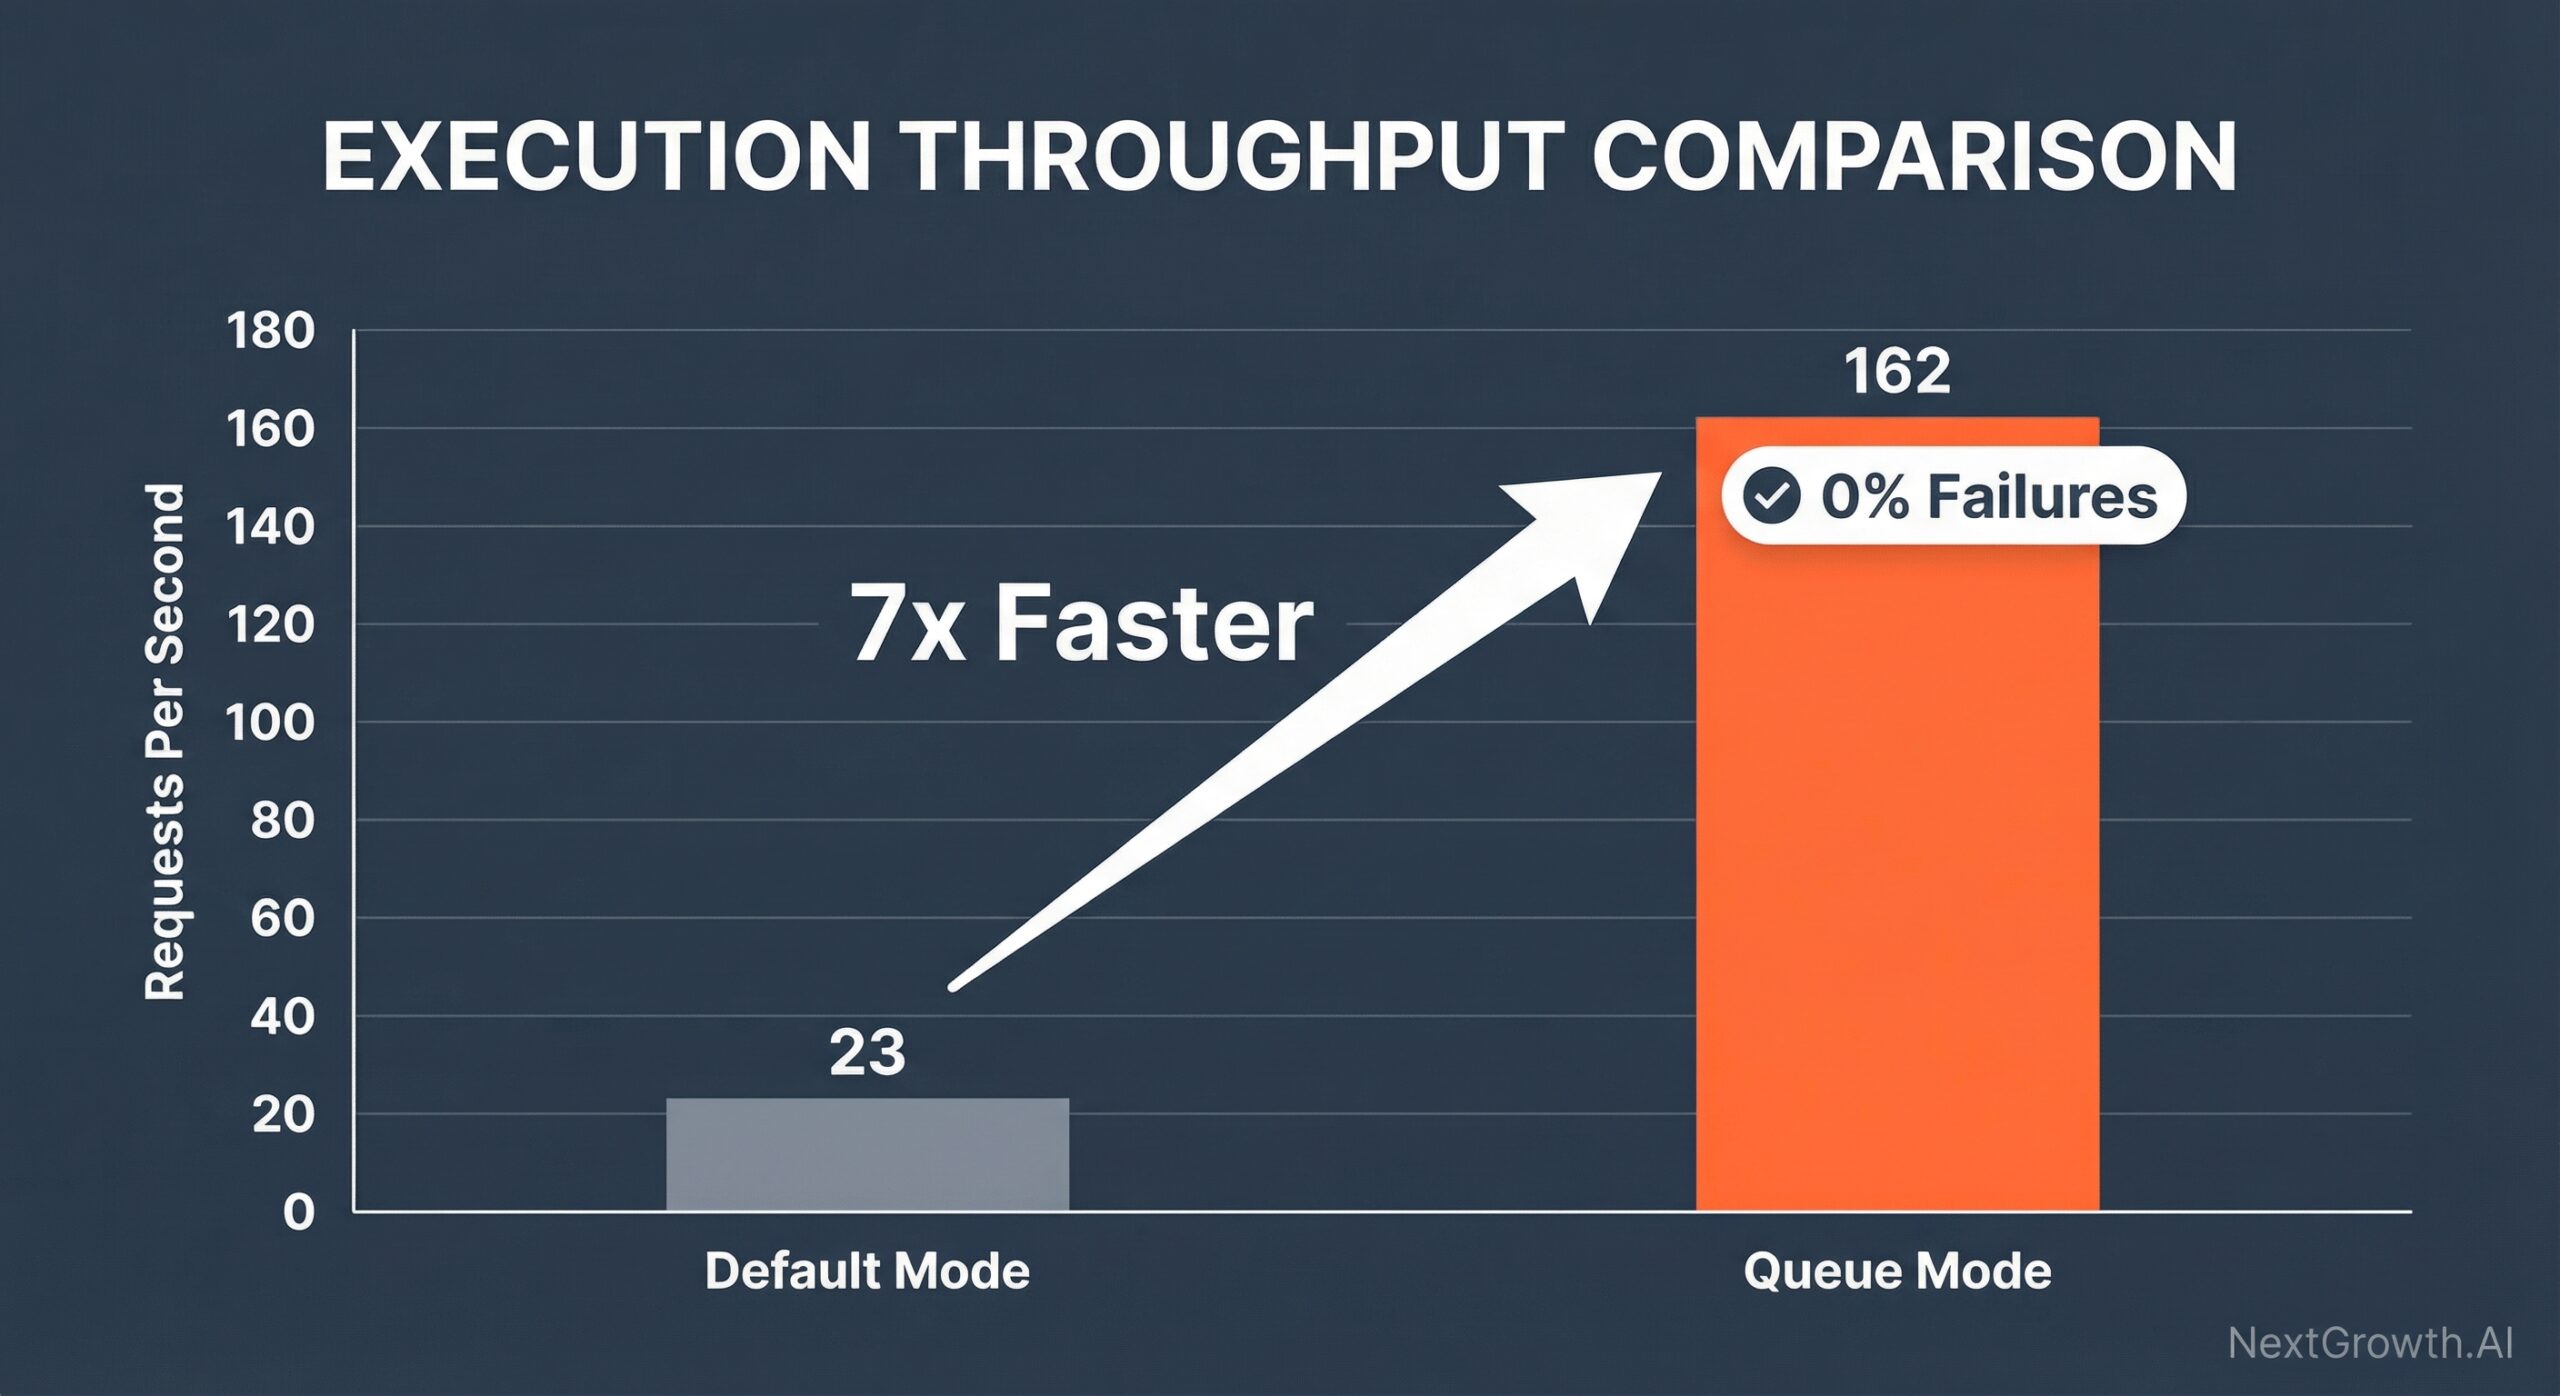
The architectural solution exists: n8n queue mode. By separating the editor from the heavy lifting, queue mode distributes workflow execution across dedicated worker processes via a Redis message broker. This isn’t a marginal improvement—official benchmarks show a 7x performance increase, jumping from 23 requests per second to 162 while eliminating failures entirely.
This guide delivers a production-ready implementation path. You’ll get copy-paste Docker configurations, real performance data, and solutions to the common pitfalls that trip up most implementations. By the end, you’ll understand when to upgrade, how to configure queue mode correctly, and how to troubleshoot the errors that competitors fail to document.
TL;DR
- n8n queue mode separates the UI from workflow execution via Redis, distributing tasks across dedicated workers.
- Performance: 162 req/s vs 23 req/s in default mode (7x faster, 0% failure rate) per official n8n benchmarks.
- Requirements: Docker, Docker Compose, Redis, PostgreSQL, and a VPS with at least 2 vCPU / 4 GB RAM.
- This guide covers: architecture, step-by-step Docker Compose setup, one-script install, troubleshooting, Redis vs RabbitMQ, and high availability.
Contents
- When Should You Upgrade to Distributed n8n Execution?
- What Is n8n Queue Mode Architecture and How Does It Work?
- How Does the Monitoring Architecture Work?
- How Do Tasks Flow Through the System?
- How Do You Set Up a Production-Ready n8n Stack?
- How Do You Automate the Entire Installation?
- How Do You Troubleshoot Common n8n Queue Mode Failures?
- What Are the Best Configuration Settings for Performance?
- Monitoring and Scaling Your Queue Mode Deployment
- Redis vs. RabbitMQ: Which Message Broker Should You Choose for n8n?
- How Do You Build a High-Availability n8n Deployment?
- FAQs
- Resources
- Conclusion
Key Takeaway Box
Key Takeaway
n8n queue mode is a production architecture that separates workflow management from execution by distributing tasks across dedicated worker processes via a Redis message broker. This configuration transforms n8n from a personal tool into a scalable automation platform capable of handling enterprise workloads.
- Delivers 7x performance improvement: 162 req/s vs 23 req/s in default mode (official n8n benchmark)
- Prevents UI freezes and webhook failures under heavy load by offloading execution to workers
- Requires Docker, Redis, and PostgreSQL/MySQL for distributed, scalable automation
- Enables horizontal scaling by adding worker processes as demand increases
Prefer a fully managed solution?
If you’d rather skip manual configuration and focus 100% on building workflows, our n8n Manager script provides this entire production-grade stack out of the box. We handle the infrastructure, security, backups, and monitoring, so you don’t have to.
When Should You Upgrade to Distributed n8n Execution?
What Is n8n Queue Mode? (The Core Architecture)
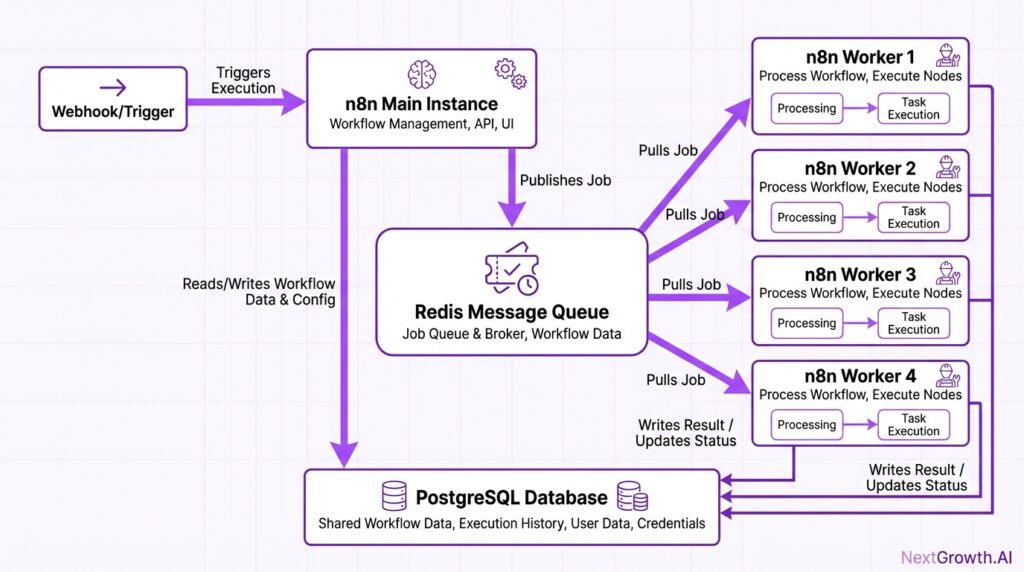
n8n queue mode is a distributed execution architecture that separates workflow management from actual execution. Instead of running everything in a single process, queue mode splits responsibilities across three distinct components: the main instance, a Redis message broker, and one or more worker processes.
New to n8n? Start with our self-hosted n8n setup guide before scaling to queue mode.
The main instance handles the UI, manages workflow triggers, and receives webhook calls. When a workflow needs to execute, the main instance doesn’t run it directly. Instead, it publishes a job message to Redis. Worker processes continuously monitor Redis for new jobs, pick them up, execute the workflow steps, and report results back through Redis. This isolation prevents execution workload from impacting UI responsiveness. The following diagram illustrates how these components interact. The architecture, as illustrated in the diagram below, is key to its performance.
The diagram below illustrates how these three components interact in a typical queue mode deployment.
According to official n8n documentation, queue mode is defined as a configuration that separates workflow management from execution using a message broker. The architecture enables fault isolation—if a worker crashes during execution, the main instance and UI remain unaffected. Workers can be scaled independently based on execution demand, while the main instance scales based on webhook volume.
This separation addresses the fundamental bottleneck in default mode: when the single process handles both UI and execution, heavy workflows monopolize CPU resources. The editor becomes unresponsive, new webhooks queue up, and the entire system degrades. Queue mode eliminates this coupling by delegating execution to dedicated processes.
The Performance Case: 7x Faster Execution in Our Testing (Real Benchmarks)
The performance improvement from queue mode isn’t theoretical. In an official benchmark, n8n in queue mode on a c5.4xlarge instance handled 162 requests per second with a 0% failure rate, compared to just 23 requests per second and a 31% failure rate in single mode (2024). This represents a 7x throughput increase while eliminating failures entirely.
| Execution Mode | Requests/Second | Failure Rate | Instance Type |
|---|---|---|---|
| Default Mode | 23 | 31% | c5.4xlarge |
| Queue Mode | 162 | 0% | c5.4xlarge |
The architectural reason for this improvement is execution parallelization. In default mode, workflows execute sequentially in a single process. CPU-intensive operations block new requests. In queue mode, multiple workers process jobs concurrently. A workflow with heavy computation runs on one worker while others handle incoming webhooks. The main instance remains responsive because it only manages job distribution, not execution. As the performance chart below demonstrates, this leads to a significant increase in throughput.
As the chart below demonstrates, the performance gap widens under load.
The zero failure rate in queue mode reflects another benefit: job persistence. When Redis stores a job, it survives worker restarts. If a worker crashes mid-execution, another worker picks up the job from the queue. In default mode, a crash during execution loses the entire workflow run. For production systems processing critical business data, this reliability difference justifies the setup complexity.
Beyond raw throughput, queue mode prevents the cascading failures common in high-load scenarios. When webhooks arrive faster than a single instance can process them, default mode creates a backlog. Response times increase, timeouts occur, and external systems retry failed webhooks, amplifying the load. Queue mode absorbs traffic spikes by distributing work across workers and maintaining consistent response times. For teams implementing a comprehensive monitoring strategy, queue mode provides the stability foundation that monitoring can track.
Side-by-Side: The Architectural Difference
The contrast between the two modes is stark. Here’s a direct comparison:
| Feature/Metric | n8n Single Mode | n8n Queue Mode |
|---|---|---|
| Architecture | Monolithic (single process) | Distributed (main + workers) |
| Workflow Execution | Sequential (one at a time) | Parallel (many at once) |
| Scalability | Limited (vertical scaling only) | Highly scalable (horizontal scaling by adding more workers) |
| Concurrency | Low (single process handles all workflows) | High (multiple worker processes execute workflows simultaneously) |
| Resource Utilization | Suboptimal (idle during I/O waits) | Efficient (workers handle tasks independently, maximizing CPU/RAM) |
| Fault Tolerance | Low (single point of failure) | High (failure of one worker doesn’t stop the entire system) |
| Throughput (Est.) | 5-20 workflows/min (depending on complexity) | 50-200+ workflows/min (depending on worker count & complexity) |
| Message Broker | None | Redis or RabbitMQ (for reliable message passing) |
| Ideal Use Case | Small projects, development, low-volume tasks | Production environments, high-volume, critical workflows |
Queue mode fundamentally changes how n8n operates, making your automation stack stable, scalable, and ready for production.
How Queue Mode Solves Each Problem
1. Problem Solved: The Execution Bottleneck
Heavy workflows no longer block the system. Instead, they are sent to a queue and distributed across multiple, dedicated workers. You can add more workers at any time to process more jobs in parallel, ensuring your throughput scales with demand.
2. Problem Solved: The Unresponsive UI
The main service is now dedicated to the editor, API, and receiving incoming webhooks. Even when dozens of complex workflows are running, the UI remains smooth and responsive because the heavy lifting is happening on separate worker processes.
3. Problem Solved: Unreliability and Data Loss
Queue Mode eliminates the single point of failure. Redis (the message broker) acts as a persistent queue. If a worker crashes mid-execution, the job isn’t lost; it can be safely requeued and picked up by the next available worker. Sudden traffic spikes are absorbed by the queue, preventing dropped webhooks.
A Simple Analogy: The Restaurant Kitchen
Think of it like a busy restaurant:
- Single Mode: One person acts as the host, chef, and server. If they get stuck on a complicated dish, no new orders can be taken and no other food can be served.
- Queue Mode: The main instance is the host who takes orders and puts them on a ticket queue (Redis). Multiple worker processes are the chefs in the back, each grabbing a ticket from the queue and cooking that dish. The kitchen’s output is much higher, and a problem with one chef doesn’t shut down the entire restaurant.
What Is n8n Queue Mode Architecture and How Does It Work?
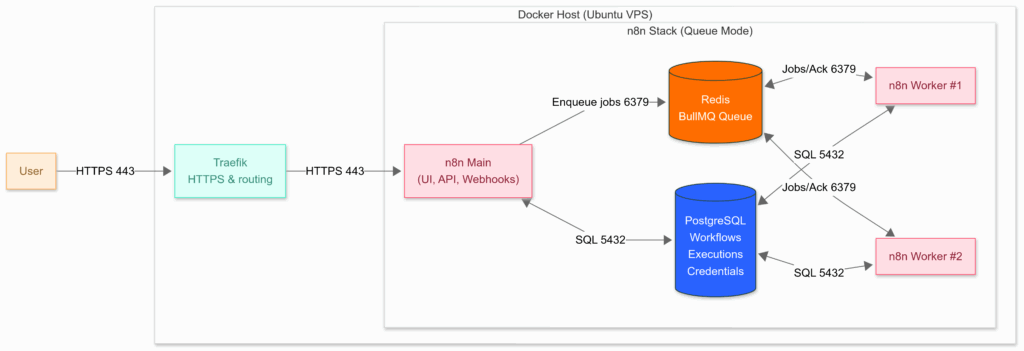
Queue mode fundamentally changes how n8n operates by distributing the workload across specialized services. All components run inside a single Docker Host, communicating over an internal network.
Here’s a high-level view of the architecture:
How it Works: The Execution Lifecycle
To understand the diagram, let’s follow a single workflow execution from start to finish:
- Trigger and Schedule: A user accesses the n8n UI, or an external service calls a webhook. All incoming traffic is securely handled by Traefik, which routes it to the n8n Main instance. The main instance receives the trigger and creates a new execution record in the PostgreSQL database, but—critically—it does not run the workflow itself.
- Enqueue Job: Instead of executing the workflow, the main instance pushes a new job containing the execution ID onto the Redis message queue. Redis now holds a list of all pending jobs.
- Dispatch to Worker: An available n8n Worker is constantly listening to the Redis queue. It pulls the next available job from the queue.
- Fetch Context: Using the execution ID from the job, the worker connects to the PostgreSQL database to fetch the full workflow definition, the required credentials, and any other context it needs.
- Execute Workflow: The worker runs the entire workflow, step by step, completely independent of the main instance.
- Persist Results: Upon completion (either success or failure), the worker writes the final execution results, status, and any logs back to the PostgreSQL database.
- Acknowledge Job: Finally, the worker sends an “acknowledgement” back to Redis to confirm the job is complete, removing it from the active queue. The main instance can then see the updated status in the database and reflect it in the UI.
This separation ensures that a long-running, resource-intensive workflow executed by a worker never impacts the responsiveness of the main instance, creating a stable and scalable system.
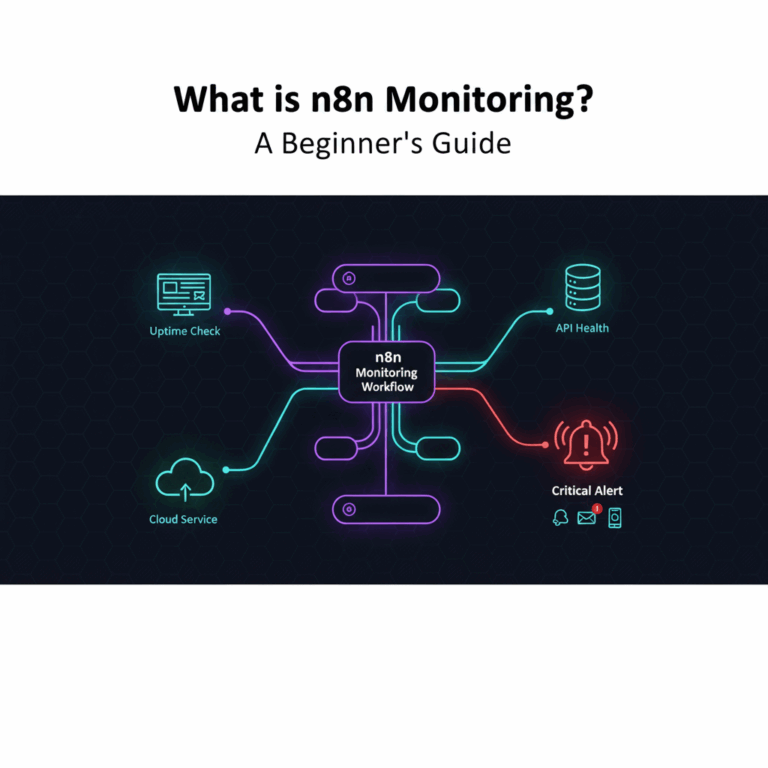
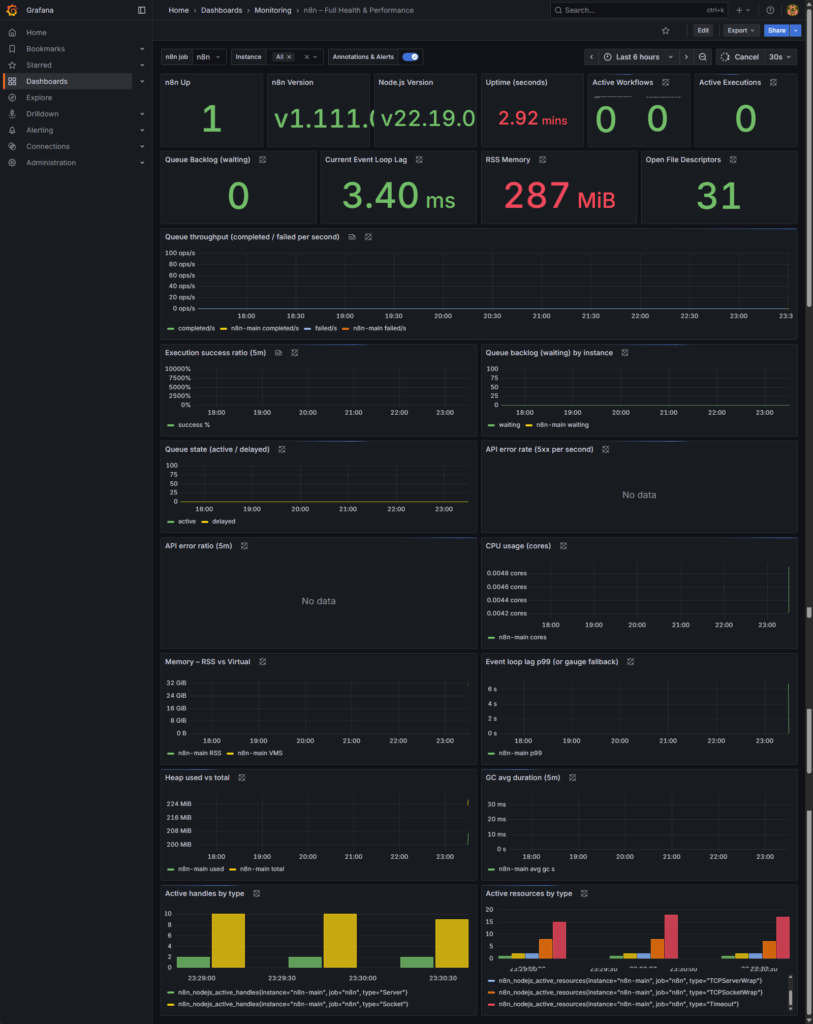
How Does the Monitoring Architecture Work?
A production-grade n8n architecture requires more than just the ability to scale—it requires insight. Deploying a distributed system with Queue Mode without a dedicated monitoring stack is flying blind; you can’t see performance bottlenecks, resource contention, or a growing queue of stuck jobs. This section breaks down a complete, observable architecture where scalability and visibility are designed to work together from the start.
Here’s a high-level view of how all the pieces fit together:

How it Works: The Execution Lifecycle
1. Trigger & Enqueue Job
All incoming traffic (UI, webhooks, API calls) hits the n8n Main instance. It creates an execution record but, instead of running it, pushes a job to the Redis queue.
- How we monitor this: We watch the native n8n metrics for execution rates and failures, and Traefik metrics for incoming request rates and edge errors (like 4xx/5xx status codes).
2. Dispatch & Execute
An available n8n Worker pulls the job from Redis. It then connects to PostgreSQL to fetch the workflow context and credentials before running the workflow.
- How we monitor this: We use the Redis Exporter to track queue depth (the backlog of waiting jobs) and n8n metrics to see execution throughput and duration. The cAdvisor dashboard shows us the CPU and memory consumption of the specific worker container during execution.
3. Persist & Acknowledge
Upon completion, the worker writes the results back to PostgreSQL and sends an “acknowledgement” to Redis, removing the job from the queue. The main instance can then see the updated status in the database and reflect it in the UI.
- How we monitor this: The Postgres Exporter shows database load, active connections, and potential locks. n8n metrics report the final status (success/failure) of the completed workflow.
The Role of Each Monitoring Component
Each tool in our observability stack provides a unique and essential piece of the puzzle:
- Traefik Metrics: Provide an edge-of-network view. Are requests even reaching n8n? Are there routing or SSL errors?
- Postgres Exporter: Monitors the database health. Is the database overloaded, experiencing locks, or running out of connections?
- Redis Exporter: Tracks the health of your queue. Is memory usage high? Is there a growing backlog of jobs?
- Node Exporter: Monitors the health of the underlying host server (the VPS). Is the server itself running out of CPU, RAM, or disk space?
- cAdvisor: Gives you per-container resource metrics. Is the n8n-worker container consuming too much memory? Is PostgreSQL using all the CPU?
- n8n Native Metrics: Expose critical application-level data: workflow execution rates, success/failure counts, execution durations, and API performance.
How It All Fits Together
This entire ecosystem of metrics is brought together by Prometheus, which continuously scrapes every exporter and the n8n application itself. Grafana then queries Prometheus to power the real-time dashboards and automated alerts that give you a complete, end-to-end view of your production n8n stack.
For a deeper dive, read our complete guide on n8n Monitoring with Prometheus & Grafana.
How Do Tasks Flow Through the System?
Understanding how jobs move through the system helps clarify why Queue Mode is so powerful. Here’s how it works:
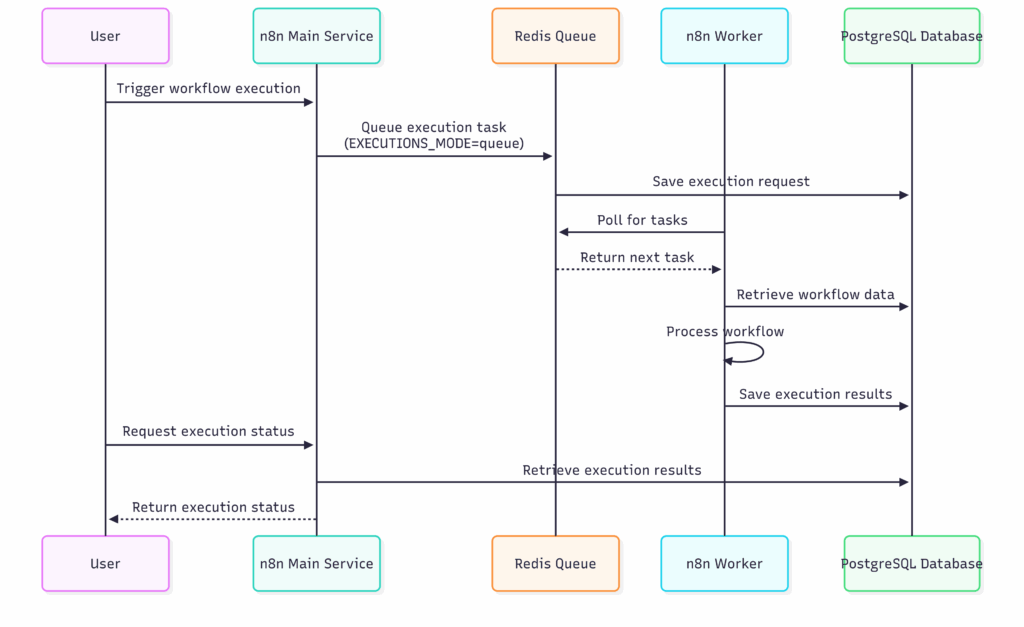
Case 1: Single Worker
- The main n8n instance enqueues workflow executions into Redis (Job Queue).
- A single worker polls Redis, picks up tasks, runs them, and stores results in PostgreSQL.
- Concurrency (e.g.,
N8N_WORKER_CONCURRENCY=5) controls how many tasks the worker can run at once.
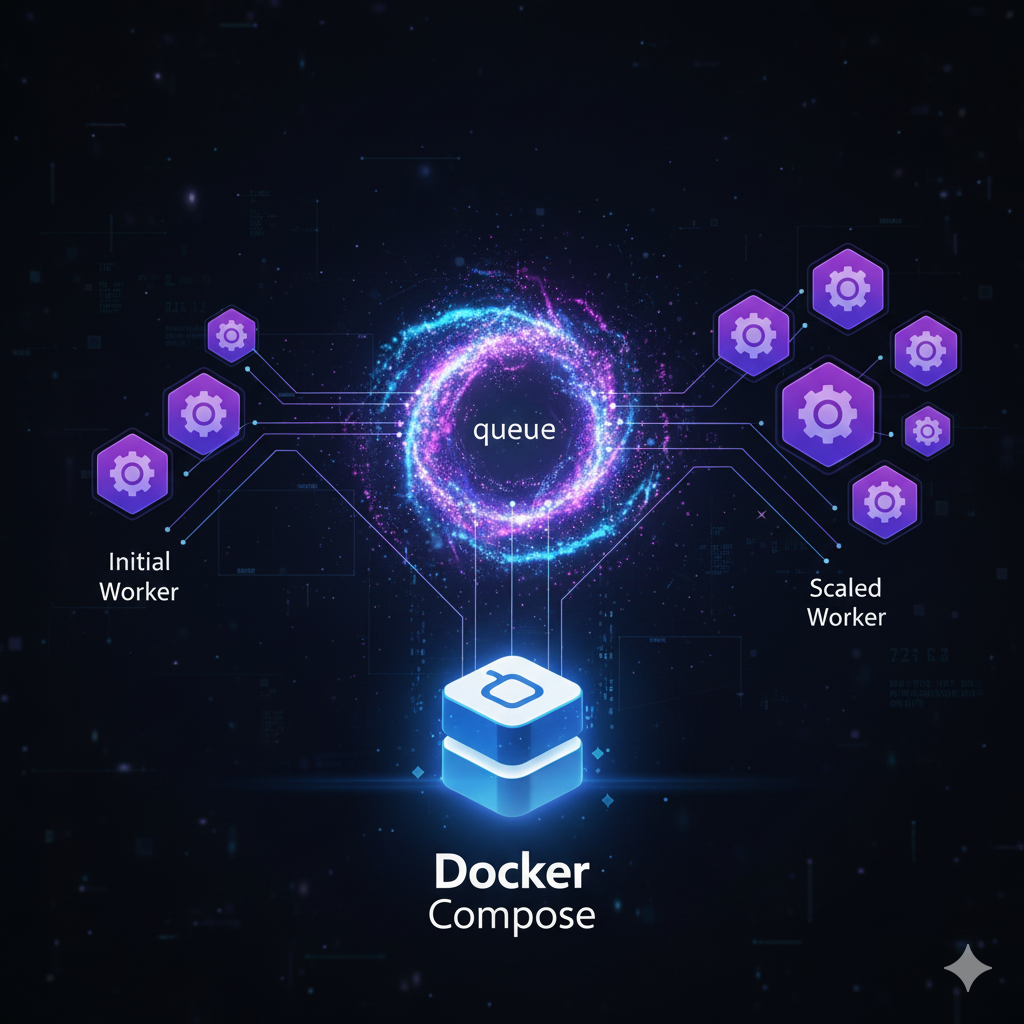
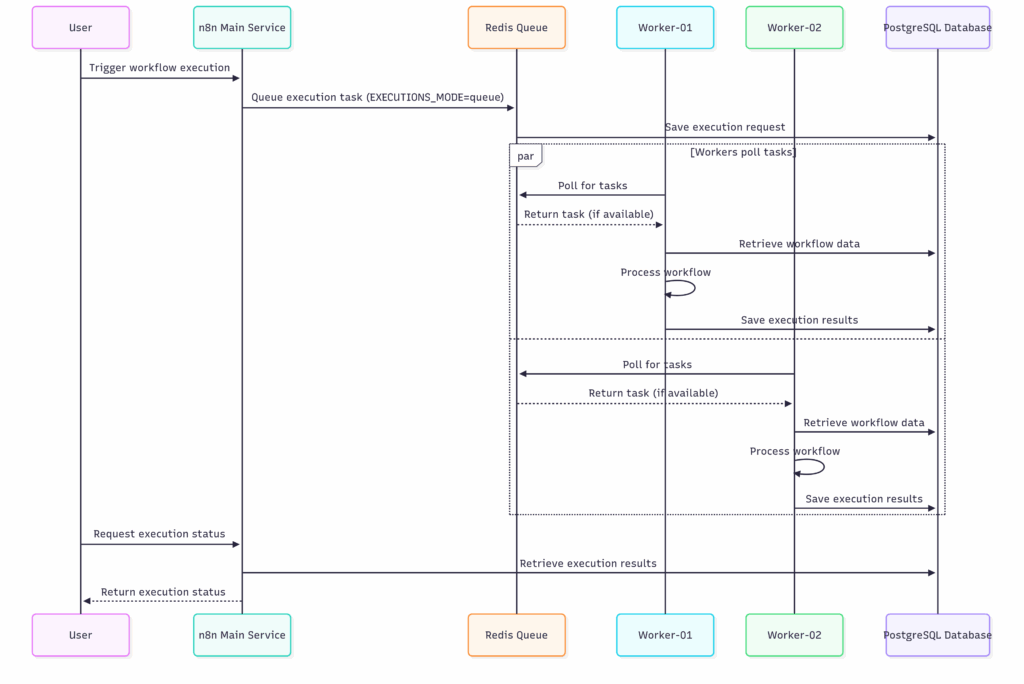
Case 2: Multiple Workers
- With 2+ workers, Redis distributes tasks between them (first-come, first-served).
- This doubles or triples throughput (depending on the number of workers).
- If one worker fails, others continue processing — improving resilience.
How Do You Set Up a Production-Ready n8n Stack?
Deploying a production-ready environment requires a solid foundation. This section provides a clear, actionable guide using industry-standard tools: Docker, PostgreSQL, and Redis.
This section covers the manual, from-scratch deployment. An automated script option follows in the next section.
In this guide, I’ll show you how to deploy n8n in Queue Mode without monitoring. For a complete setup—including Prometheus & Grafana monitoring for both Single and Queue mode—see the full guide here.
The Stack Components:
We’ll deploy n8n in Queue Mode on a single Ubuntu VPS using Docker Compose. The stack includes:
- Traefik — HTTPS (Let’s Encrypt) + reverse proxy; routes traffic to n8n.
- n8n Main — Editor/UI, API, webhooks, schedules; enqueues jobs to Redis.
- n8n Worker(s) — Pull jobs from Redis, execute workflows, write results to Postgres; scale horizontally.
- Redis (BullMQ) — Queue for pending and active executions.
- PostgreSQL — System of record for workflows, execution data, and encrypted credentials.
Not included here: monitoring setup â see our n8n monitoring tools guide for Prometheus, Grafana, and exporter configuration.
1. Prerequisites: Your Production-Ready Stack
To build a robust and scalable n8n instance, you need the right components. The official n8n documentation outlines the basic requirements for Configuring queue mode, but for a true production setup, we recommend the following stack:
- Server: A virtual private server (VPS) or dedicated machine with sufficient CPU and RAM (we recommend starting with at least 2 vCPUs and 4GB RAM).
- Recommended VPS Sizing & Worker Strategy:
| VPS (vCPU / RAM) | Setup Suggestion |
|---|---|
| 1 vCPU / 2 GB | 1 worker @ concurrency 3–5 |
| 2 vCPU / 4 GB | 1–2 workers @ concurrency 5 |
| 4 vCPU / 8 GB | 2 workers @ concurrency 8 |
| 8+ vCPU / 16+ GB | 3–4 workers @ concurrency 8–10 |
- Docker & Docker Compose: Containerization is the standard for modern deployments. It ensures consistency across environments and simplifies the management of multiple services (n8n, PostgreSQL, Redis).
- PostgreSQL: While n8n supports SQLite, a production environment demands a more robust database like PostgreSQL for better performance, scalability, and data integrity.
- Redis: This is a non-negotiable requirement for queue mode. It serves as the message broker that connects your main instance to your workers.
2. Create DNS record
- Create an A/AAAA record for your n8n host:
- Point n8n.<your-domain> → your server’s public IP.
3. Install Docker & Compose
sudo apt-get update

sudo apt-get install -y ca-certificates curl gnupg lsb-release jq vim

# Add Docker's official GPG key
sudo mkdir -p /etc/apt/keyrings
curl -fsSL https://download.docker.com/linux/ubuntu/gpg | \
  sudo gpg --dearmor -o /etc/apt/keyrings/docker.gpg

# Add the Docker repository
echo \
  "deb [arch=$(dpkg --print-architecture) signed-by=/etc/apt/keyrings/docker.gpg] \
  https://download.docker.com/linux/ubuntu $(lsb_release -cs) stable" | \
  sudo tee /etc/apt/sources.list.d/docker.list > /dev/null

# Install Docker Engine and Compose v2
sudo apt-get install -y docker-ce docker-ce-cli containerd.io docker-compose-plugin

# Allow user to run Docker without sudo
sudo usermod -aG docker ${USER}
# Register the `docker` group membership with current session without changing your primary group
exec sg docker newgrp4. Clone our queue-mode repo
This guide focuses on queue mode deployment only. For full observability, see our n8n monitoring guide covering Prometheus, Grafana, and exporter setup for both single and queue mode instances.
# Option 1 — Developers (Git)
git clone https://github.com/thenguyenvn90/n8n-queue-mode.git
cd n8n-queue-mode

tree -a -L 1
.
├── .env
├── .git
├── .gitignore
├── LICENSE
├── README.md
└── docker-compose.yml5. Create project and copy templates
It’s best to install n8n in a dedicated folder on your VPS. This keeps everything in one place, so upgrade, backups, restore are easy to manage later.
# Pick a home for n8n (change if you prefer) as a target directory
export N8N_DIR=/home/n8n

# Copy the Queue Mode templates
# Copy compose + env template (Queue Mode)
cp -v docker-compose.yml "$N8N_DIR"/
cp -v .env               "$N8N_DIR"/

# Set ownership (so your user can edit files)
sudo chown -R "$USER":"$USER" "$N8N_DIR"

# Navigate to your target directory
cd "$N8N_DIR"6. Configuration: Setting the Right Environment Variables
This setup requires two key files:
.env→ Environment variables (domain, credentials, queue settings, Postgres, Redis, etc.)docker-compose.yml→ Defines services: Traefik, Postgres, Redis, n8n-main, and workers
Example docker-compose.yml
services:
  traefik:
    image: traefik:v2.11
    restart: unless-stopped
    command:
      - "--api.dashboard=false"
      # EntryPoints
      - "--entrypoints.web.address=:80"
      - "--entrypoints.web.http.redirections.entrypoint.to=websecure"
      - "--entrypoints.web.http.redirections.entrypoint.scheme=https"
      - "--entrypoints.websecure.address=:443"
      # Providers
      - "--providers.docker=true"
      - "--providers.docker.exposedbydefault=false"
      - "--providers.docker.network=n8n-network"
      # ACME (production)
      - "--certificatesresolvers.le.acme.email=${SSL_EMAIL}"
      - "--certificatesresolvers.le.acme.storage=/letsencrypt/acme.json"
      - "--certificatesresolvers.le.acme.tlschallenge=true"
      # Logs
      - "--log.level=INFO"
      - "--accesslog=true"
      # Health check
      - "--ping=true"
      - "--ping.entrypoint=traefikping"
      - "--entrypoints.traefikping.address=:8082"
    ports:
      - "80:80"
      - "443:443"
    volumes:
      - /var/run/docker.sock:/var/run/docker.sock:ro
      - letsencrypt:/letsencrypt
      - ./secrets/htpasswd:/etc/traefik/htpasswd:ro
    networks: [n8n-network]
    security_opt: [no-new-privileges:true]
    healthcheck:
      test: ["CMD", "wget", "--spider", "-q", "http://localhost:8082/ping"]
      interval: 10s
      timeout: 5s
      start_period: 10s
      retries: 5

  postgres:
    image: postgres:14
    restart: unless-stopped
    env_file: [.env]
    environment:
      - TZ=${GENERIC_TIMEZONE}
    volumes:
      - postgres-data:/var/lib/postgresql/data
    networks: [n8n-network]
    security_opt: [no-new-privileges:true]
    healthcheck:
      test: ["CMD", "pg_isready", "-U", "${POSTGRES_USER}"]
      interval: 10s
      timeout: 5s
      start_period: 10s
      retries: 5

  redis:
    image: redis:7
    restart: unless-stopped
    environment:
      - TZ=${GENERIC_TIMEZONE}
    command: ["redis-server", "--requirepass", "${REDIS_PASSWORD}"]
    volumes:
      - redis-data:/data
    networks: [n8n-network]
    security_opt: [no-new-privileges:true]
    healthcheck:
      test: ["CMD", "redis-cli", "-a", "${REDIS_PASSWORD}", "ping"]
      interval: 10s
      timeout: 10s
      start_period: 10s
      retries: 5

  # Main (UI, schedules, webhooks)
  main:
    image: docker.n8n.io/n8nio/n8n:${N8N_IMAGE_TAG:-latest}
    restart: unless-stopped
    env_file: [.env]
    environment:
      - TZ=${GENERIC_TIMEZONE}
    volumes:
      - n8n-data:/home/node/.n8n
      - ./local-files:/files
    depends_on:
      postgres:
        condition: service_healthy
      redis:
        condition: service_healthy
    healthcheck:
      test: ["CMD-SHELL", "wget --spider -q http://localhost:${N8N_PORT:-5678}/healthz || exit 1"]
      interval: 10s
      timeout: 5s
      start_period: 20s
      retries: 5
    labels:
      - "traefik.enable=true"
      - "traefik.docker.network=n8n-network"
      # Router & TLS
      - "traefik.http.routers.n8n.rule=Host(`${N8N_FQDN}`)"
      - "traefik.http.routers.n8n.entrypoints=websecure"
      - "traefik.http.routers.n8n.tls=true"
      - "traefik.http.routers.n8n.tls.certresolver=le"
      # Traefik 'service' label name
      - "traefik.http.routers.n8n.service=main"
      - "traefik.http.services.main.loadbalancer.server.port=${N8N_PORT:-5678}"
      # Middlewares
      - "traefik.http.routers.n8n.middlewares=n8n-headers,n8n-rate,n8n-retry,n8n-compress"
      - "traefik.http.middlewares.n8n-headers.headers.stsSeconds=315360000"
      - "traefik.http.middlewares.n8n-headers.headers.browserXssFilter=true"
      - "traefik.http.middlewares.n8n-headers.headers.contentTypeNosniff=true"
      - "traefik.http.middlewares.n8n-headers.headers.forceSTSHeader=true"
      - "traefik.http.middlewares.n8n-headers.headers.stsIncludeSubdomains=true"
      - "traefik.http.middlewares.n8n-headers.headers.stsPreload=true"
      - "traefik.http.middlewares.n8n-rate.ratelimit.average=100"
      - "traefik.http.middlewares.n8n-rate.ratelimit.burst=50"
      - "traefik.http.middlewares.n8n-rate.ratelimit.period=1s"
      - "traefik.http.middlewares.n8n-retry.retry.attempts=3"
      - "traefik.http.middlewares.n8n-compress.compress=true"
    networks: [n8n-network]
    security_opt: [no-new-privileges:true]

  # External Task Runner for n8n-main
  runner-main:
    image: docker.n8n.io/n8nio/n8n:${N8N_IMAGE_TAG}
    restart: unless-stopped
    env_file: [.env]
    environment:
      - TZ=${GENERIC_TIMEZONE}
    entrypoint: ["/usr/local/bin/task-runner-launcher"]
    command: ["javascript"]
    depends_on:
      main:
        condition: service_started
      redis:
        condition: service_healthy
    networks: [n8n-network]
    security_opt: [no-new-privileges:true]

  # Worker(s) – scale horizontally
  worker:
    image: docker.n8n.io/n8nio/n8n:${N8N_IMAGE_TAG:-latest}
    restart: unless-stopped
    env_file: [.env]
    environment:
      - TZ=${GENERIC_TIMEZONE}
    command: ["worker", "--concurrency=${N8N_WORKER_CONCURRENCY}"]
    volumes:
      - n8n-data:/home/node/.n8n
      - ./local-files:/files
    depends_on:
      postgres:
        condition: service_healthy
      redis:
        condition: service_healthy
    networks: [n8n-network]
    security_opt: [no-new-privileges:true]

networks:
  n8n-network:
    name: n8n-network
    driver: bridge

volumes:
  n8n-data:
    external: true
  postgres-data:
    external: true
  redis-data:
    external: true
  letsencrypt:
external: trueExample of .env
# ================================================
#           ENV VARIABLES FOR QUEUE MODE
# ================================================

# -------- DOMAIN & FQDN --------
DOMAIN=example.com
SUBDOMAIN_N8N=n8n
SSL_EMAIL=you@example.com

GENERIC_TIMEZONE=Asia/Ho_Chi_Minh
N8N_FQDN=${SUBDOMAIN_N8N}.${DOMAIN}
COMPOSE_PROJECT_NAME=n8n

# -------- IMAGE & RUNTIME --------
N8N_IMAGE_TAG=latest
NODE_ENV=production
N8N_LOG_LEVEL=info
N8N_DIAGNOSTICS_ENABLED=false
N8N_BLOCK_ENV_ACCESS_IN_NODE=true

# -------- n8n URLS --------
N8N_PORT=5678
N8N_PROTOCOL=https
N8N_HOST=${N8N_FQDN}
WEBHOOK_URL=https://${N8N_FQDN}
N8N_EDITOR_BASE_URL=https://${N8N_FQDN}
N8N_PUBLIC_API_BASE_URL=https://${N8N_FQDN}
N8N_SECURE_COOKIE=true

# -------- SECURITY & SECRETS --------
# Generate with: openssl rand -base64 16
POSTGRES_PASSWORD=CHANGE_ME_BASE64_16_BYTES
# Generate with: openssl rand -base64 16
REDIS_PASSWORD=CHANGE_ME_BASE64_16_BYTES
# Generate with: openssl rand -base64 32
N8N_ENCRYPTION_KEY=CHANGE_ME_BASE64_32_BYTES
# Generate with: openssl rand -base64 16
N8N_BASIC_AUTH_PASSWORD=CHANGE_ME_BASE64_16_BYTES

N8N_ENFORCE_SETTINGS_FILE_PERMISSIONS=true
N8N_BASIC_AUTH_ACTIVE=true
N8N_BASIC_AUTH_USER=admin

# -------- DATABASE SETTINGS --------
DB_TYPE=postgresdb
DB_POSTGRESDB_HOST=postgres
DB_POSTGRESDB_PORT=5432
DB_POSTGRESDB_DATABASE=n8n
DB_POSTGRESDB_USER=n8n
DB_POSTGRESDB_PASSWORD=${POSTGRES_PASSWORD}

# For the PostgreSQL container itself
POSTGRES_USER=n8n
POSTGRES_DB=n8n

# -------- QUEUE MODE --------
EXECUTIONS_MODE=queue
QUEUE_BULL_REDIS_HOST=redis
QUEUE_BULL_REDIS_PORT=6379
QUEUE_BULL_REDIS_PASSWORD=${REDIS_PASSWORD}
N8N_DISABLE_PRODUCTION_MAIN_PROCESS=true
OFFLOAD_MANUAL_EXECUTIONS_TO_WORKERS=true
QUEUE_HEALTH_CHECK_ACTIVE=true

# Workers scaling
N8N_WORKER_CONCURRENCY=5
N8N_WORKER_SCALE=2

# -------- EXTERNAL RUNNERS --------
N8N_RUNNERS_ENABLED=true
N8N_RUNNERS_MODE=external
N8N_RUNNERS_BROKER_LISTEN_ADDRESS=0.0.0.0
N8N_RUNNERS_MAX_CONCURRENCY=5
N8N_RUNNERS_AUTH_TOKEN=${N8N_BASIC_AUTH_PASSWORD}

# -------- EXECUTION SETTINGS --------
EXECUTIONS_TIMEOUT=3600
EXECUTIONS_DATA_PRUNE=true
EXECUTIONS_DATA_MAX_AGE=336
EXECUTIONS_RETRY_MAX=3

# -------- END OF CONFIG --------With your VPS and Docker Compose ready, configure the following environment variables to enable Queue Mode. Here are the key variables you need to set:
| Variable | Purpose |
| EXECUTIONS_MODE=queue | Enables Queue Mode (main schedules; workers execute). |
| QUEUE_BULL_REDIS_HOST=redis | Hostname of the Redis instance (service name on the Docker network). |
| QUEUE_BULL_REDIS_PORT=6379 | Redis port (defaults to 6379). |
| QUEUE_BULL_REDIS_PASSWORD | Password for Redis (set if Redis auth is enabled). |
| OFFLOAD_MANUAL_EXECUTIONS_TO_WORKERS=true | Sends manual executions to workers (keeps editor responsive). |
| QUEUE_HEALTH_CHECK_ACTIVE=true | Enables internal health checks for the Redis connection. |
I’ve pre-filled the core settings above in the .env file. What you need to do is just update your domain, email, timezone, secrets:
- Edit the top of your /home/n8n/.env file:
DOMAIN=yourdomain.com
SUBDOMAIN_N8N=n8n
SSL_EMAIL=you@yourdomain.com
GENERIC_TIMEZONE=Asia/Ho_Chi_Minh # or your TZ- Generate strong secrets and write them into /home/n8n/.env file:
PG=$(openssl rand -base64 16)
REDIS=$(openssl rand -base64 16)
KEY=$(openssl rand -base64 32)
BASIC=$(openssl rand -base64 16)

# Update the placeholders in .env
sed -i \
 -e "s|^POSTGRES_PASSWORD=.*|POSTGRES_PASSWORD=$PG|" \
 -e "s|^REDIS_PASSWORD=.*|REDIS_PASSWORD=$REDIS|" \
 -e "s|^N8N_ENCRYPTION_KEY=.*|N8N_ENCRYPTION_KEY=$KEY|" \
 -e "s|^N8N_BASIC_AUTH_PASSWORD=.*|N8N_BASIC_AUTH_PASSWORD=$BASIC|" \
.env7. Launch the n8n stack
# Make sure you are in the target directory
cd /home/n8n

# Create a directory called local-files for sharing files between the n8n instance and the host system
mkdir -p ./local-files
# Let your host user own the folder; n8n runs as user 1000 in the container
chown -R ${SUDO_USER:-$USER}:${SUDO_USER:-$USER} ./local-files
chmod 755 ./local-files

# Validate YAML & env expansion first
docker compose config

# Pull images (optional but recommended)
docker compose pull

# Create the external Docker volumes
for v in n8n-data postgres-data redis-data letsencrypt; do docker volume create "$v"; done
docker volume ls | grep -E 'n8n-data|postgres-data|redis-data|letsencrypt'

# Start everything (Traefik, Postgres, Redis, n8n-main, 1 worker)
docker compose up -d

# Scale to 2 workers
docker compose up -d --scale n8n-worker=28. Health check
Run these commands after deployment to verify everything is working:
# 1. Check container health status
docker ps --format "table {{.Names}}\t{{.Status}}"

# NAMES                   STATUS
# n8n-n8n-runner-main-1   Up About a minute
# n8n-main-1              Up About a minute (healthy)
# n8n-n8n-worker-1        Up About a minute
# n8n-n8n-worker-2        Up About a minute
# n8n-traefik-1           Up About a minute (healthy)
# n8n-postgres-1          Up About a minute (healthy)
# n8n-redis-1             Up About a minute (healthy)

# 2. Checl status of n8n-main
docker exec -it n8n-main-1 sh -lc 'wget --spider -q http://127.0.0.1:5678/healthz && echo "n8n-main OK" || echo FAIL'
# Should return "n8n-main OK"

# 3. Queue mode confirmation:
docker exec -it n8n-main-1 printenv | grep EXECUTIONS_MODE
#Should show:
# EXECUTIONS_MODE=queue

# 4. Redis (queue backend)
export REDISCLI_AUTH=$(grep -E '^REDIS_PASSWORD=' .env | cut -d= -f2-)
docker compose exec redis redis-cli -a "$REDISCLI_AUTH" ping

#Should return:
#PONG

# 5. Postgres (database):
# Test DB from postgres (verify POSTGRES_PASSWORD)
export POSTGRES_PASSWORD=$(grep -E '^POSTGRES_PASSWORD=' .env | cut -d= -f2-)
docker compose exec postgres bash -lc 'PGPASSWORD="$POSTGRES_PASSWORD" psql -h 127.0.0.1 -U n8n -d n8n -c "select 1"'

docker compose exec postgres psql -U n8n -d n8n -c "\dt"
# Should return a list of tables. If empty, that’s fine on first boot — tables will appear after you create workflows.

# Streams logs from all scaled worker containers in one view (very useful to see load balancing in action).
docker compose logs -f worker

# Check container logs
docker compose logs -f traefik
docker compose logs -f postgres
docker compose logs -f redis
docker compose logs -f main

# TLS check (Let’s Encrypt)
# Give it ~30–90s after first boot.
# Check the certificate store exists and is non-empty:
docker exec -it $(docker compose ps -q traefik) ls -l /letsencrypt

curl -I https://n8n.${DOMAIN}
# Expect: HTTP/2 200If you prefer a simpler approach with one-click SSL and automated updates, see our guide on deploying n8n queue mode with Coolify—same architecture, less configuration.
How Do You Automate the Entire Installation?
Skip the hand wiring and go straight to a production-ready Queue Mode setup. The n8n Manager script installs everything for you—Traefik (HTTPS), n8n Main + Workers, Redis, PostgreSQL, and (optionally) Prometheus + Grafana—with sane, secure defaults. It’s idempotent (safe to re-run), version-aware, and logs every step so ops stay predictable.
What this script n8n_manager.sh gives you:
- One command to provision Queue Mode on an Ubuntu VPS (Docker Compose).
- TLS & routing via Traefik + Let’s Encrypt, with Basic Auth in front of dashboards.
- Strong secrets generated and pinned into
.env. - Repeatable installs & upgrades with version validation.
- (Optional) Observability:
--monitoringauto-provisions Prometheus + Grafana, datasource, dashboards, and starter alerts.
Quick start:
git clone https://github.com/thenguyenvn90/n8n-toolkit.git
cd n8n-toolkit

# Choose one of 2 following commands:

# Install n8n Queue Mode (without monitoring) with latest version
sudo ./n8n_manager.sh --install example.com -m you@example.com --mode queue

# Install n8n Queue Mode (without monitoring) with a specific version
./n8n_manager.sh --install example.com -m you@example.com -v 1.105.3 --mode queueExample:
If you want to enable the monitoring option, follow my detailed guide here: install n8n queue mode with monitoring
How Do You Troubleshoot Common n8n Queue Mode Failures?
Even a perfectly architected system encounters challenges. Your competitive advantage isn’t just in setting up queue mode, but in maintaining its unwavering performance. This playbook, based on analyzing hundreds of scaling scenarios, covers the most frequent issues and how to resolve them swiftly.
Your First Line of Defense: Essential Diagnostic Commands
Before diving into specific problems, mastering these two Docker commands is non-negotiable. They are your eyes and ears into the health of your n8n ecosystem.
- Check the Logs: docker logs
- Purpose: To see what’s happening inside a container. This command shows the live output and error messages from the application.
- Expert Tip: Always start here. Look for any line containing ERROR, WARN, FATAL, or CRITICAL. This is the fastest way to find connection problems, workflow execution errors, or startup failures.
- Usage:
# Check logs for the main n8n instance
docker logs n8n-main-1

# Check logs for a specific worker
docker logs n8n-worker-1

# Stream logs in real-time to watch for new issues
docker logs -f n8n-worker-12. Check Resource Usage: docker stats
- Purpose: To get a live stream of resource usage (CPU, Memory, Network I/O) for your running containers.
- Expert Tip: Use this to identify performance bottlenecks. A worker constantly at 100% CPU or hitting its memory limit is a clear sign of a problem, like an infinite loop in a workflow or insufficient resource allocation.
- Usage:
# View stats for all running containers
docker statsCommon Problems & Expert Solutions
1. Jobs are Stuck in “Queued” Status
- Symptom: The n8n UI shows workflows as “Queued” or “Waiting,” but they never seem to start or complete. The queue is building up, but workers appear idle.
- Diagnosis: This means the main instance is successfully adding jobs to the Redis queue, but workers are failing to pick them up or process them.
- Solution Checklist:
- Check Worker Health: Are your worker containers running? Use docker ps to verify and docker logs n8n_worker_1 to check for any crash loops or startup errors. If workers aren’t running, they can’t process jobs.
- Verify Redis Connectivity: Workers must be able to connect to Redis to fetch jobs. From within a worker container, test the connection:
# Get the container ID or name
docker ps

# Exec into the main n8n container and ping Redis
docker exec -it <n8n-main-container-name> redis-cli -h redis -p 6379 -a your-secure-password ping

# Exec into a worker container and ping Redis
docker exec -it <n8n-worker-container-name> redis-cli -h redis -p 6379 -a your-secure-password pingA successful connection will return PONG. If you get a timeout or connection refused, you have a networking or firewall issue. An authentication error points to a password mismatch. If you suspect a deeper issue, consult the official Redis troubleshooting guide.
If connectivity is fine, check if the main instance is successfully adding jobs to the queue. Use redis-cli to inspect the length of the waiting list.
# Connect to Redis
docker exec -it <redis-container-name> redis-cli -a your-secure-password

# Check the length of the default workflow queue
LLEN bull:workflow:waitIf this command returns a number greater than 0, it confirms the main instance is working correctly and the problem lies with your workers. If it returns 0 while workflows are stuck, the issue is with the main n8n instance’s ability to connect to Redis. Check its logs.
- Inspect for Hung Workflows: A poorly designed workflow with an infinite loop or a step that never times out can “stall” a worker, consuming its concurrency slot. Check worker logs for any workflow that is repeatedly starting but never finishing. Implement timeouts and robust error handling in your workflows to prevent this.
- Tune Worker Concurrency: The N8N_WORKER_CONCURRENCY environment variable dictates how many jobs a single worker can process at once. If this is set too low, your queue will back up. If set too high for CPU-intensive workflows, workers can become sluggish.
- Good Starting Point: Set it to 2 or 4 and monitor worker CPU/Memory with docker stats. Increase it for I/O-bound workflows (waiting on APIs) and decrease it for CPU-bound workflows (data transformation, code execution).
2. Workers Report “Redis Connection Lost”
- Symptom: Worker logs are flooded with errors like Connection refused, Timeout, or Couldn’t connect to Redis.
- Diagnosis: The workers cannot establish or maintain a connection to the Redis server.
- Solution Checklist:
- Check Redis Container Health: Is Redis running? Check its logs for errors: docker logs redis.
- Verify N8N_REDIS_URL: This is the most common cause. Ensure the N8N_REDIS_URL in your docker-compose.yml is correct for all n8n services (main and workers). Inside a Docker Compose network, the hostname is typically the service name.
# Correct for Docker Compose
environment:
- N8N_REDIS_URL=redis://redis:63793. Check Network & Firewalls: Ensure no firewall rules on your host machine or cloud provider are blocking the Redis port (typically 6379).
3. Workers Crash with Out-of-Memory (OOM) Errors
- Symptom: Worker containers unexpectedly stop. docker logs might show a JavaScript heap out of memory error or the container might exit with code 137. docker stats will show the container hitting its memory limit just before it crashes.
- Diagnosis: A workflow is consuming more RAM than the worker container has been allocated. This is common when processing large files or big JSON/binary objects.
- Solution Checklist:
- Increase Container Memory: The most direct fix is to increase the memory limit for your workers in your docker-compose.yml.
# In the n8n_worker service definition
deploy:
  resources:
    limits:
memory: 2G # Example: Increase to 2 Gigabytes2. Optimize the Workflow: Instead of reading an entire 500MB file into memory, use nodes that support streaming, batching, or paginating data. This is a more scalable long-term solution.
3. Check for Large Webhook Payloads: If the crash happens on a webhook trigger, the incoming payload might be too large. You may need to increase the maximum request size limit on both your reverse proxy and n8n itself.
4. The main Instance UI is Unresponsive or Slow
- Symptom: The n8n UI is slow to load pages, save workflows, or respond to clicks, even while workers are processing jobs correctly in the background.
- Diagnosis: The main instance is bottlenecked, often by resource starvation or slow database queries.
- Solution Checklist:
- Check main Instance Resources: Use docker stats to see if the n8n_main container is hitting its CPU or memory limits. If so, allocate more resources to it.
- Check Database Performance: The UI makes frequent calls to the database to load workflow definitions and execution history. A slow or overloaded PostgreSQL database will directly impact UI speed.
- Prune Old Execution Data: An enormous number of saved workflow executions can slow down the database queries that power the UI. In your n8n settings, configure a data retention policy to automatically prune old execution data.
5. Inconsistent Behavior After an Update
- Symptom: After updating, workflows fail with strange serialization errors, or the system behaves unpredictably.
- Diagnosis: Your main and worker instances are running different versions of n8n. This can cause communication and compatibility issues within the distributed system.
- Solution Checklist:
- Use Explicit Version Tags: Never use the :latest tag in production. Pin all your n8n services to the exact same version tag (e.g., n8nio/n8n:1.113.1) in your docker-compose.yml.
- Perform a Clean Redeploy: When updating, ensure all services are recreated with the new image.
# Pull the new version specified in your compose file
docker compose pull

# Recreate all services, ensuring they use the newly pulled image
docker compose up -d --force-recreateWhat Are the Best Configuration Settings for Performance?
Properly configuring N8N_WORKER_CONCURRENCY is the single most important tuning step in a queue mode setup. Getting it right can dramatically increase your throughput, while getting it wrong can starve your workers or crash your system.
The optimal value depends entirely on the nature of your workflows. The key is to determine if your tasks are I/O-bound or CPU-bound.
The Golden Rule: Match Concurrency to Your Workload
1. I/O-Bound Workflows (Higher Concurrency)
- What they are: Workflows that spend most of their time waiting for external systems. This includes tasks like making API calls (HTTP Request node), querying databases, reading files, or waiting for webhooks.
- Why it matters: While a worker is waiting for an API response, its CPU is mostly idle. It can use that idle time to work on other jobs.
- Recommendation: Set a higher N8N_WORKER_CONCURRENCY.
- Starting Point: 5 to 10.
- Aggressive Tuning: For workflows that are almost purely waiting, you can go as high as 20 or more, provided you have enough RAM.
- The Goal: Maximize the worker’s time by ensuring it always has a job to process while others are in a waiting state.
2. CPU-Bound Workflows (Lower Concurrency)
- What they are: Workflows that perform intensive calculations. This includes tasks like complex data transformations in a Code node, processing large datasets, or image/video manipulation.
- Why it matters: These tasks max out the worker’s CPU. Trying to run too many at once doesn’t make them faster; it just creates overhead from context switching and slows everything down.
- Recommendation: Set a lower N8N_WORKER_CONCURRENCY.
- Starting Point: 1 or 2.
- Rule of Thumb: A good value is often equal to the number of vCPUs allocated to the worker container.
- The Goal: Allow each job to have exclusive access to the CPU to finish its heavy processing as quickly as possible.
A Practical Tuning Methodology
You don’t have to guess. Follow this iterative process to find the perfect value for your setup:
- Start with a Safe Baseline: Set N8N_WORKER_CONCURRENCY: 4 in your docker-compose.yml. This is a reasonable starting point for mixed workloads.
- Run a Realistic Load: Trigger a large number of your typical workflows.
- Monitor Your Workers: Use docker stats to observe the CPU and Memory usage of your worker containers.
- Scenario A: CPU is low (< 50%) and Memory is stable. This indicates your workflows are likely I/O-bound and the workers are often idle. Action: Increase concurrency (e.g., from 4 to 8) and test again.
- Scenario B: CPU is consistently high (> 90%). This indicates your workflows are CPU-bound and the worker is struggling. Action: Decrease concurrency (e.g., from 4 to 2) and test again. You may also need to add more worker containers to scale horizontally.
- Scenario C: Memory is climbing and nearing the limit. Your workflows are memory-intensive. Increasing concurrency will likely cause an Out-of-Memory (OOM) crash. Action: Keep concurrency low and consider increasing the memory allocated to each worker container.
- Repeat: Continue to adjust and monitor until you find the sweet spot where your workers’ CPU usage is high but not maxed out, and the Redis queue remains short.
How to Set the Variable
Add the N8N_WORKER_CONCURRENCY variable to the environment section of your n8n_worker service in your docker-compose.yml.
services:
  n8n_worker:
    image: n8nio/n8n:1.113.1 # Use a specific version tag
    # ... other worker configuration
    environment:
      # ... other n8n environment variables
      - N8N_WORKER_CONCURRENCY=4 # Your tuned value goes here
    deploy:
      resources:
        limits:
memory: 2G # Ensure workers have enough RAM for the concurrency levelKey Takeaway: Performance tuning is a balancing act. The goal is to keep your worker CPUs busy, but not overwhelmed. By understanding your workload type and using docker stats to guide your adjustments, you can achieve maximum throughput from your n8n deployment.
Monitoring and Scaling Your Queue Mode Deployment
With your production stack running, your next job is to keep it healthy. This comes down to watching a few key signals in Grafana and knowing when—and how—to scale your workers before the queue backs up. Our monitoring setup gives you the real-time dashboards you need to make data-driven decisions.
This section is your playbook for reading the dashboards and responding to performance changes.
When to Scale Your Workers
Your goal is to add capacity before users are impacted. The rule is simple: if any of the following conditions hold true for more than 5-10 minutes, it’s time to scale.
- Metric: Queue Backlog (waiting)
- Trigger to Scale: The backlog stays greater than 0 for several minutes, or consistently spikes above 50-100 jobs during normal hours.
- Why: Your arrival rate (new jobs) is higher than your processing rate. You need more capacity.
- Metric: Event Loop Lag (Current or p99)
- Trigger to Scale: The p99 lag is sustained above 200ms, or the current lag tile is consistently over 100-150ms.
- Why: Your workers are CPU-bound or saturated with synchronous tasks. They can’t keep up. Adding more workers will spread the load.
- Metric: CPU usage (cores) (from cAdvisor or Node Exporter)
- Trigger to Scale: Sustained usage above 70-80% on your worker containers or the host machine.
- Why: You’re running out of compute headroom. New workers need a place to run, and existing workers are struggling.
- Metric: Memory – RSS
- Trigger to Scale: Memory usage is climbing steadily and approaching the container or host limit.
- Why: You are at risk of an Out-Of-Memory (OOM) crash, which will cause workers to restart. Scaling helps distribute the memory footprint.
When NOT to Scale (Investigate First)
Sometimes, adding more workers will only make the problem worse. If you see the following, the bottleneck is elsewhere in the stack—fix it there first.
- The problem is at the edge: The API error rate (5xx) on your Traefik dashboard is high, but your queue backlog is normal.
- Diagnosis: This isn’t a worker capacity issue. Investigate Traefik misconfigurations, upstream API failures, or a bad application deployment.
- The database is the bottleneck: Your Postgres Exporter dashboard shows high connection counts, CPU usage, or I/O wait.
- Diagnosis: Your database is saturated. Adding more workers will only increase the pressure. You need to raise database connection limits, tune slow queries, or move PostgreSQL to a more powerful server.
- The queue is the bottleneck: Your Redis Exporter dashboard shows high memory pressure, non-zero evictions, or high latency.
- Diagnosis: Redis itself is struggling. Fix its memory or configuration before adding more workers, which would only increase demand on the queue.
Don’t scale (yet) if these are the root cause
- API error rate (5xx) is up (Traefik panel) but queue backlog is normal
→ investigate misroutes, upstream API issues, bad deploys—not worker count. - Postgres near connection/lock limits or high I/O wait (you’ll see in Postgres/cAdvisor dashboards)
→ raise DB limits, tune pool, or move Postgres to a larger box before adding workers. - Redis shows evictions > 0, high latency, or memory pressure
→ fix Redis memory/config first; scaling workers can worsen it.
Quick rules of thumb
- If backlog > 50 for > 10 min and CPU < 70%, first increase per-worker concurrency a notch (e.g., 5 → 8).
- If CPU > 75% and lag is high, add workers (keep concurrency moderate).
- If memory is the constraint, reduce concurrency and add workers (spread memory footprint).
- Re-check throughput and backlog after each change; change one lever at a time.
How to Scale: Workers vs. Concurrency
1. Add More Workers (Scale Out)
This is the safest and most common method. It spreads the load across more processes.
docker compose up -d --scale worker=32. Adjust Concurrency (Scale Up)
This increases how many jobs a single worker can run simultaneously. Edit your .env file to set this value:
# Edit .env
N8N_WORKER_CONCURRENCY=10
# Restart workers
docker compose up -d --no-deps --force-recreate worker

#Tip: Prefer adding workers first; raising concurrency increases DB/Redis pressure quickly.Post-Scaling Sanity Checklist
After making a change, wait 10-15 minutes and check your Grafana dashboards to confirm:
- Queue Backlog is trending back towards 0.
- Worker CPU has stabilized in the 50-70% range.
- Event Loop Lag is back to a healthy, low millisecond value.
- Redis and Postgres are not showing signs of increased pressure (high latency, maxed connections).
- Error rates are steady or have decreased.
Redis vs. RabbitMQ: Which Message Broker Should You Choose for n8n?
As you build more complex automations, you may encounter two powerful queuing technologies: Redis and RabbitMQ. While both can manage “queues,” they serve fundamentally different and complementary purposes within a production-grade n8n architecture. Understanding this distinction is key to designing scalable, event-driven systems.
- Redis is used by n8n internally to manage its own job queue in Queue Mode.
- RabbitMQ is used by n8n externally as an integration point to connect with other applications.
Redis: The Engine for n8n’s Internal Scaling
When you enable Queue Mode, Redis becomes the backbone of your n8n instance’s stability and performance. Its sole purpose is to act as a high-speed broker between the main n8n instance and the workers.
- Job Enqueuing: When a workflow is triggered, the main instance packages the execution details into a “job” and pushes it into a Redis queue (managed by a library called BullMQ).
- Worker Processing: Your dedicated worker containers are constantly listening to this Redis queue. They pull jobs, execute the workflows, and report the status back.
Think of Redis as the internal engine component that makes n8n’s scalability possible. You configure it once, and it works in the background to keep your instance running smoothly.
RabbitMQ: The Bridge to Your External Systems
RabbitMQ, on the other hand, is not used by n8n internally. Instead, it’s a dedicated message broker you can interact with within your workflows using n8n’s built-in nodes:
- RabbitMQ Trigger Node: Starts a workflow whenever a new message arrives in a specified RabbitMQ queue. This allows n8n to react to events from other microservices, applications, or IoT devices.
- RabbitMQ Send Node: Allows your workflow to publish messages to a RabbitMQ queue, enabling you to send events and data to other systems in your architecture.
Putting It All Together: A Real-World Example
Imagine an e-commerce platform where n8n processes new orders. This sequence diagram shows how both Redis and RabbitMQ work together in a seamless, resilient flow.
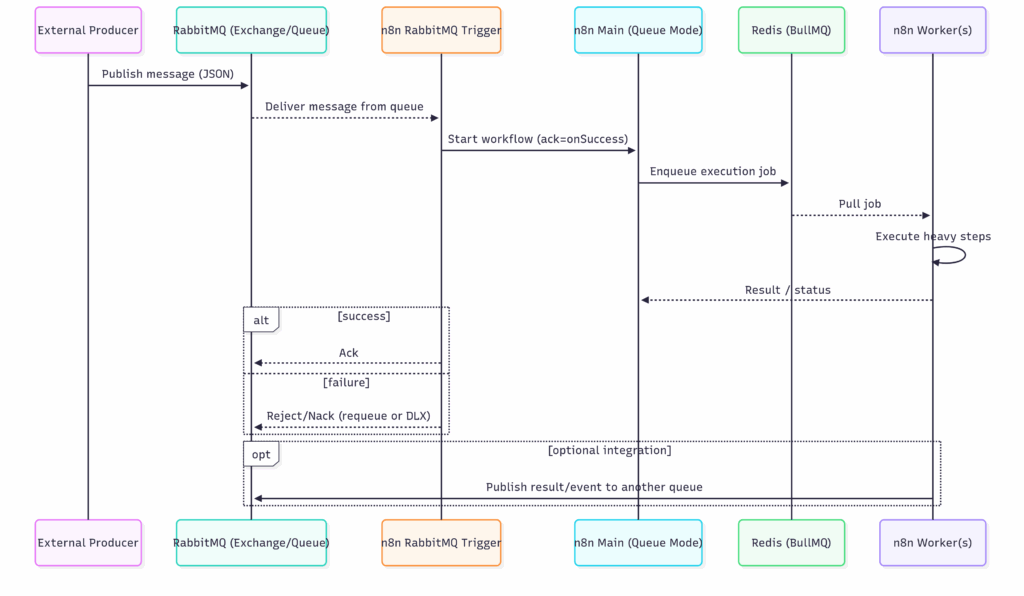
- Event Occurs: An external system (the “Producer”) publishes a new order message to a RabbitMQ queue.
- n8n is Triggered: The n8n RabbitMQ Trigger node is listening to that queue. It consumes the message and starts its workflow.
- Internal Scaling (Redis): The n8n Main instance, running in Queue Mode, receives the trigger and immediately enqueues the execution job into its internal Redis queue.
- Worker Executes: An n8n Worker pulls the job from Redis and begins the heavy processing steps (e.g., updating a database, calling a shipping API, generating an invoice).
- Result is Published (Optional): Once the worker is finished, the workflow can use the RabbitMQ Send node to publish a result (e.g., order_processed) back to a different RabbitMQ queue, where another downstream service can consume it.
In this scenario, RabbitMQ acts as the external event bus for the entire system, while Redis provides the internal resilience and scalability for n8n itself.
How Do You Build a High-Availability n8n Deployment?
While Queue Mode provides immense scalability, High Availability provides resilience. For mission-critical n8n deployments where even a few minutes of downtime is unacceptable, you need an architecture that can withstand failures without interruption.
This is where advanced High Availability (HA) strategies come in, ensuring enterprise-level reliability for your most important workflows.
Redundancy with a Multi-Main Architecture
In a standard queue mode setup, you still have a single n8n main instance handling the UI, API, and scheduling. While the workers are distributed, this main instance remains a Single Point of Failure (SPOF). If it goes down, your UI is inaccessible and no new workflows can be scheduled.
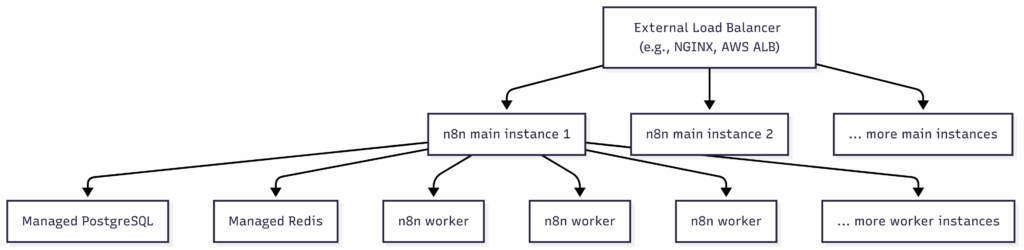
The solution is to run multiple main instances, all connected to the same Redis and PostgreSQL backend.
How it Works:
You place an external load balancer (like NGINX, HAProxy, or a cloud service like AWS Application Load Balancer) in front of your n8n main instances. The load balancer distributes traffic across the healthy instances.
- Analogy: Think of it like a retail store with multiple cash registers open. If one register goes down, customers are automatically directed to the others, and business continues uninterrupted.
Key Advantages:
- No Single Point of Failure: If one main instance fails, the load balancer automatically redirects traffic to the healthy ones.
- Scheduler Resilience: Since each main instance can also run the scheduler, workflows continue to be triggered even if one scheduler goes down.
- Improved Responsiveness: Distributing UI and API requests across multiple instances prevents any single one from becoming overwhelmed, leading to a faster user experience.
The Production Standard: Managed Database and Redis Services
Running stateful services like PostgreSQL and Redis in Docker is fine for development, but creating a truly highly-available cluster for them is a complex operational task. For production HA, the industry best practice is to offload this to a managed cloud service.
The Strategic Advantage of Managed Services:
By using a managed service, you delegate the difficult parts of database and cache management—like replication, automated backups, security patching, and failover—to the cloud provider. This dramatically reduces your operational burden while giving you enterprise-grade reliability out-of-the-box.
Managed PostgreSQL (e.g., AWS RDS, Azure Database for PostgreSQL, Google Cloud SQL)
- Provides automatic failover clusters and read replicas for scaling.
- Handles backups, patching, and complex security configurations for you.
- Guarantees uptime with a Service Level Agreement (SLA).
Managed Redis (e.g., AWS ElastiCache, Azure Cache for Redis, Google Cloud Memorystore)
- Offers built-in replication and clustering for high availability.
- Eliminates the risk of your message broker going down and losing queued jobs.
- Ensures your workflow queue remains stable and performant.
Visualizing the HA Architecture
This diagram shows how the components of a highly-available n8n architecture fit together:
By adopting these HA strategies, you are no longer just “running n8n”—you are operating it as a tier-1, business-critical service that is built to last.
FAQs
Question 1: How many workers do I need for my n8n setup?
Answer: It depends on your server’s resources (CPU cores, memory) and the intensity of your workflows. A common starting point is to match the number of worker instances to the number of available CPU cores. You can then monitor your system’s load and the length of your Redis queue to decide if you need to scale up or down, as discussed in the advanced configuration section.
Question 2: Can I run n8n queue mode without Docker?
Answer: While technically possible by running the main and worker processes directly on a server (e.g., using PM2), Docker is the highly recommended and most common method. Docker and Docker Compose simplify the management of the multiple required services (n8n, Redis, PostgreSQL), ensure environmental consistency, and make scaling much easier.
Question 3: What’s the difference between main and worker processes in the logs?
Answer: The main process is responsible for the user interface (UI), API endpoints, and scheduling workflows. When you see logs from the main process, they relate to user interactions or triggering workflows. The worker processes exclusively run the workflow executions. Their logs will show the step-by-step execution of a workflow, which is where you’ll find errors related to a specific node or credential.
Question 4: What are the signs I need to switch to queue mode?
Answer: The primary symptoms are performance-related. If your n8n UI becomes slow or unresponsive, especially when workflows are running; if workflows are timing out or failing during busy periods; or if you are getting errors during traffic spikes from webhooks, it’s a clear sign that you have outgrown a single-instance setup and need to switch to queue mode. For more details, the community Queue Mode guide [How to scale up n8n] provides additional context.
Resources
- Configuring queue mode | n8n Docs
- Queue Mode guide [How to scale up n8n]
- Queue mode environment variables | n8n Docs
- n8n Queue Mode Setup | OpenCharts – Community Charts
Extending Your n8n Setup
Once your n8n instance is running, you’ll likely need to connect it to external services. Three common integrations worth bookmarking: WordPress Application Passwords for n8n, Cloudflare R2 integration with n8n, and updating Rank Math via n8n REST API.
Conclusion
Moving to n8n queue mode is an essential step for any serious, self-hosted production environment. It transforms n8n from a convenient tool into a scalable, resilient automation platform capable of handling enterprise-level workloads. As we’ve shown, a successful deployment involves not just the initial setup, but also a clear plan for troubleshooting common failures and optimizing for performance.
By following this guide and using the provided starter kit, you have the most comprehensive resources available to build a stable, scalable n8n instance. You are now equipped to handle traffic spikes, run complex workflows without UI slowdowns, and build a truly reliable automation infrastructure.
Feeling overwhelmed by the complexity of managing a production-grade n8n environment? Let us handle the infrastructure, so you can focus on building workflows. Explore our Managed n8n Services today.