
Best Website Analytics Tools: Ultimate 2026 Comparison
The best website analytics tools in 2026 are Google Analytics 4 for free comprehensive tracking, Plausible for privacy-first simplicity, and Mixpanel for product analytics — your best pick depends on whether you prioritize depth, privacy, or user behavior analysis.
Disclosure: This post contains affiliate links. If you purchase through our links, we may earn a commission at no extra cost to you. We only recommend tools we’ve tested and use ourselves. For a comprehensive guide, see our our complete on-page SEO guide.
GA4’s forced migration in July 2023 pushed millions of teams to re-evaluate their analytics stacks for the first time in years—and Google Trends confirms that interest in GA4 alternatives has stayed elevated ever since. The way people evaluate analytics software has fundamentally shifted, but most comparison guides still read like recycled 2024 feature tables.
Here’s the real problem: GA4’s complexity sends teams scrambling for alternatives, yet most “best website analytics tools” lists hand you a feature matrix without addressing what actually matters — which category of tool fits your business model, your compliance requirements, and your data philosophy. For more details, see our web scraping tools. Choose wrong, and you risk losing months of historical data, violating GDPR, or paying enterprise prices for startup-stage needs.
This guide takes a different approach, informed by NextGrowth.ai’s hands-on evaluation of each platform. Instead of ranking tools 1 through 10, you’ll learn which of four analytics categories — Data Sovereignty, Predictive Growth, User Behavior, or Product Analytics — matches your goals. By the end, you’ll know exactly which tool to trial, which to skip, and why the “best” tool is the one that fits your strategy.
For tracking keyword positions alongside analytics, see our rank tracking tools roundup.
I’ve configured analytics stacks for multiple sites, from basic GA4 setups to custom event tracking pipelines feeding into n8n automation workflows. The recommendations below reflect real implementation experience, not just feature comparisons — I’ve dealt with the migration headaches, tracking gaps, and reporting limitations firsthand.
We cover 10 tools across five categories: comprehensive platforms, free options, privacy-first alternatives, behavior analytics, and SaaS product analytics.
Key Takeaways
The best website analytics tools in 2026 fall into four strategic categories — and the right choice depends on your compliance needs, budget, and data philosophy, not just features.
- GA4 dominates market share (~44%) but defaults to a 2-month data retention limit
- Privacy-first tools (Plausible, Fathom) eliminate cookie banners and GDPR risk entirely
- Free isn’t free — GA4 trades your visitor data for $0 pricing
- Behavior analytics (Hotjar, Clarity) answer “why” users leave, not just “how many”
- SaaS teams need event-based analytics (Mixpanel, Amplitude), not pageview tools
Contents
- Which Website Analytics Tools Are Best for Your Use Case?
- Best Free Website Analytics Tools Worth Using
- Privacy-First Analytics: GDPR-Compliant Alternatives That Skip the Cookie Banner
- User Behavior Analytics: Heatmaps, Session Recordings, and the “Why” Behind Your Data
- Product Analytics for SaaS: Event Tracking, Retention, and Growth Metrics
- What Are the Limitations of Analytics Tools, and When Should You Get Expert Help?
- Frequently Asked Questions
- Conclusion
Which Website Analytics Tools Are Best for Your Use Case?
The best website analytics tools in 2026 span four distinct categories: general traffic analytics, privacy-first platforms, behavior analytics, and product analytics. GA4 commands roughly 44% of all websites globally according to W3Techs market share data, but the fastest-growing segment is privacy-compliant alternatives. Choosing the right category matters more than choosing the “best” individual tool.
Top website analytics tools at a glance:
- Google Analytics 4 — best for predictive audiences and Google Ads integration
- Matomo — best for full data ownership and self-hosted control
- Plausible Analytics — best for lightweight, cookie-free simplicity
- Fathom Analytics — best for agencies managing multiple sites
- Microsoft Clarity — best for free heatmaps and session recordings
- Hotjar — best for user feedback surveys and behavior research
- Mixpanel — best for SaaS product event tracking
- Amplitude — best for enterprise behavioral cohort analysis
Google Analytics 4 (GA4): The Complex Industry Standard
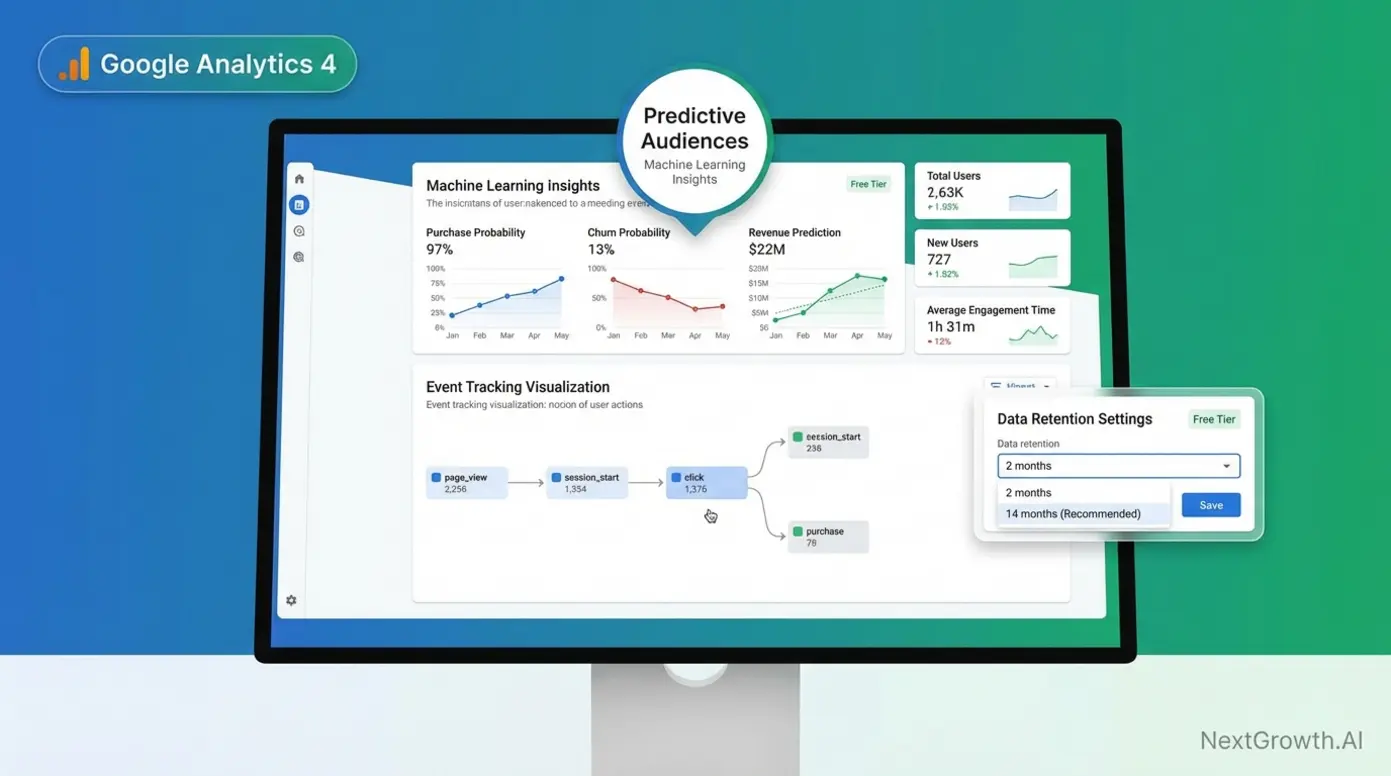
Google Analytics 4 (GA4), Google’s free, industry-standard web analytics platform, is used by approximately 44.3% of all websites globally (W3Techs, 2026). It remains the default choice for most marketing teams — and for good reason. GA4’s integration with Google Ads, Looker Studio, and BigQuery creates an ecosystem no competitor can fully replicate.
GA4’s standout feature is predictive audiences — machine learning models that identify users likely to convert or churn within seven days. Google reports that predictive audiences can deliver up to 4.3x conversion uplift when used for targeted campaigns. For teams running paid acquisition, this capability alone justifies GA4’s learning curve.
But GA4 has a critical flaw most guides ignore: its free tier defaults to 2-month data retention. You can extend this to 14 months in settings, but that only applies to user-level and event-level data in Explorations — not standard reports. After that window closes, your historical exploration data is gone. To keep data longer, you need either BigQuery exports (limited to 1 million events daily on the free tier) or a GA360 upgrade, which starts at approximately $50,000 per year.
Consider this scenario: a small business runs a holiday campaign in Q4 2025. By March 2026, they want to compare Q1 performance against their holiday baseline. If they haven’t manually configured retention settings or set up BigQuery exports, those Q4 insights have already been deleted.
Key Specs: Free (GA360: ~$50K/year) | 14-month max retention (free) | 10M events/month before sampling | Predictive audiences built-in
Pros:
- Unmatched Google ecosystem integration (Ads, BigQuery, Looker Studio)
- Predictive audiences with up to 4.3x conversion uplift potential
- Free tier is genuinely powerful for basic marketing analytics
Cons:
- 2-month default data retention catches teams off-guard
- Steep learning curve compared to Universal Analytics
- Your visitor data feeds Google’s advertising ecosystem
Real-World Usage: GA4 works well for marketing teams running Google Ads campaigns where cross-channel attribution and predictive targeting matter. It struggles when teams need long-term historical data without BigQuery expertise, when privacy regulations restrict US data transfers, or when non-technical team members need quick answers. Developer-heavy audiences using ad blockers can cause 25-40% data loss through client-side tracking gaps.
Verdict: GA4 is the right choice if your priority is Google Ads optimization and you have the technical capacity to configure retention settings and BigQuery exports. For teams valuing simplicity or data sovereignty, alternatives deliver more with less friction.
GA4’s free tier is powerful, but if data ownership and privacy compliance matter more to your business than predictive AI, Matomo offers a fundamentally different approach.
Matomo: The Self-Hosted Powerhouse
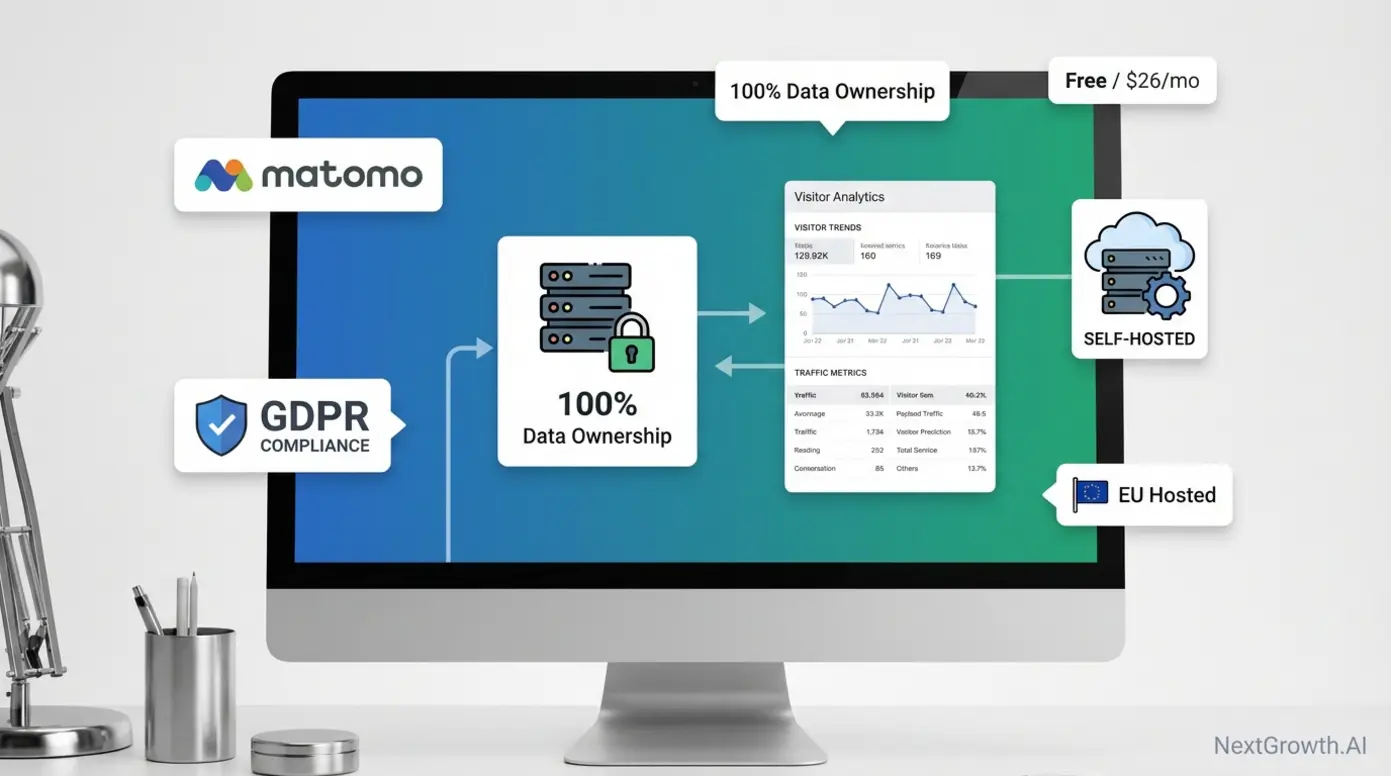
Matomo, a privacy-focused, open-source analytics platform offering full data ownership, is the leading self-hosted alternative to GA4. When you host Matomo on your own server, no data leaves your infrastructure. For EU businesses concerned about GDPR enforcement and transatlantic data transfers, this architecture eliminates the compliance risk at its root.
Matomo’s pricing model splits into two paths. The self-hosted version is free — you only pay for hosting, typically €5–20/month on a VPS. Matomo Cloud, the managed SaaS option, starts at $26/month (2026 pricing). Self-hosting requires basic technical skills — FTP access, database setup, and periodic updates — but sits well within reach for most technical marketers.
Feature-wise, Matomo approaches GA4 parity: goals, funnels, real-time visitors, a built-in tag manager, and optional heatmap/session recording add-ons (paid plugins for self-hosted). User consensus across developer forums consistently rates Matomo’s interface as more intuitive than GA4’s.
“Matomo is free, very easy to set up using FTP and a DB. It has a neat interface with all relevant info and also a good and user friendly mobile…”
A practical example: a mid-size EU e-commerce company migrating from Universal Analytics can self-host Matomo on a €10/month VPS, retain full GDPR compliance without cookie consent banners (when configured for first-party cookieless analytics), and maintain 100% data ownership — all without sending a single data point to US servers.
Key Specs: Free (self-hosted) / $26+/mo (Cloud) | Unlimited data retention (self-hosted) | GDPR compliant out-of-box | Open source
Pros:
- 100% data ownership — no third-party access to your analytics
- Self-hosted version eliminates GDPR data transfer concerns entirely
- Interface praised as more intuitive than GA4 by user communities
Cons:
- Self-hosted requires server maintenance, updates, and monitoring
- Heatmaps and session recordings are paid add-ons, not included free
- Cloud pricing scales up quickly at higher traffic volumes
Real-World Usage: Matomo excels for EU businesses in regulated industries (finance, healthcare, government) where data sovereignty is non-negotiable. It handles e-commerce tracking, campaign attribution, and funnel analysis capably. It struggles when teams lack any server administration skills for self-hosting, or when they need the AI-powered predictive features that GA4 provides natively.
Verdict: Matomo is the best fit for organizations that prioritize data ownership and GDPR compliance over AI-driven predictions — especially those with basic server management capability.
Where Matomo gives you full control at the cost of server management, Plausible takes the opposite approach — maximum simplicity with zero maintenance.
Plausible Analytics: The Minimalist Privacy Champion
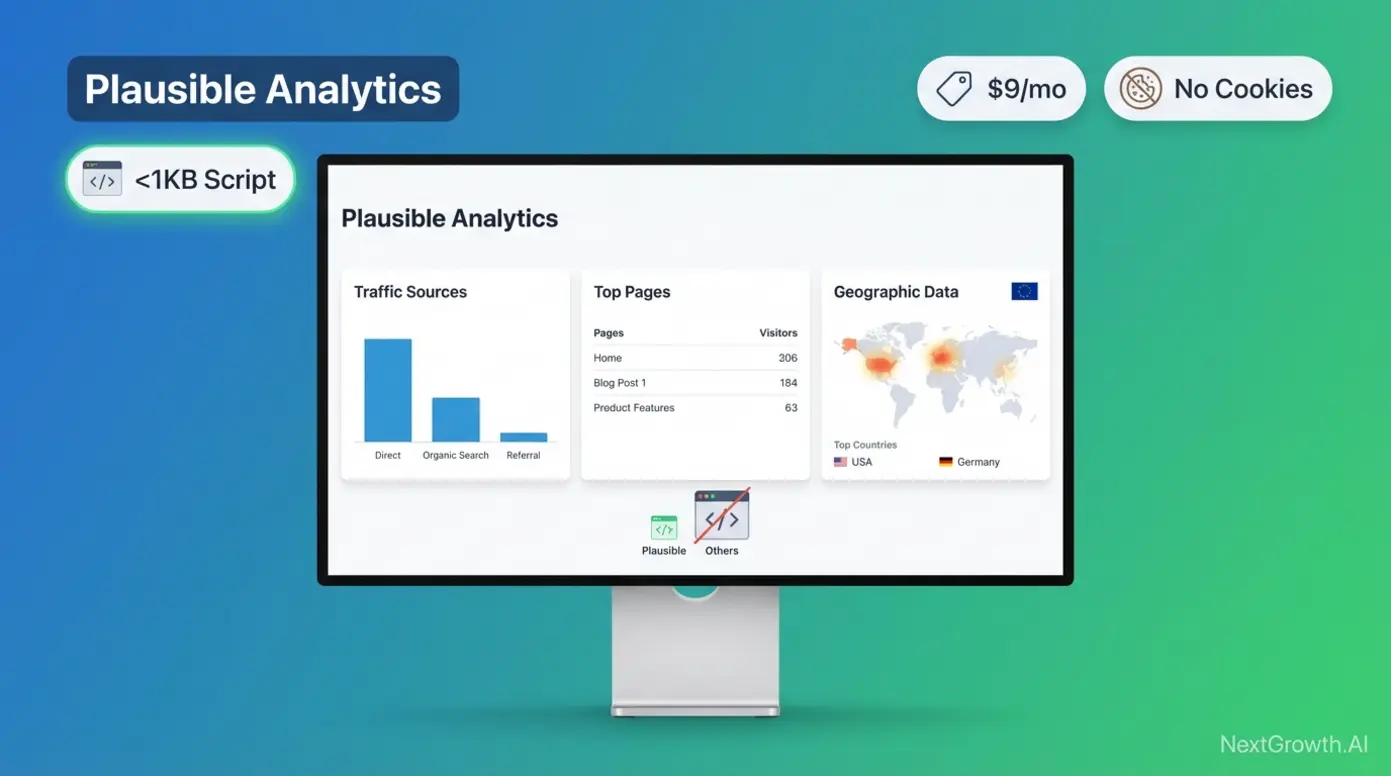
Plausible Analytics, a lightweight, cookie-free analytics tool purpose-built for GDPR compliance, strips analytics down to what actually matters. Its tracking script weighs under 1KB (compared to GA4’s ~45KB), which means zero impact on Core Web Vitals or page load speed. No cookies, no consent banners, no personal data collection.
Pricing starts at $9/month for 10,000 pageviews ($90/year billed annually), scaling with traffic volume. There’s no free tier — you pay for the product, not with your data. All plans include unlimited data retention and up to 50 websites.
The trade-off is depth. Plausible offers no funnel analysis, limited event tracking, and no predictive features. It shows you traffic sources, top pages, geographic data, and referrers — presented in a single-page dashboard you can understand in 30 seconds.
A content marketing agency managing 15 client blogs switched from GA4 to Plausible. The result: clients stopped asking about cookie compliance, page load scores improved, and the team spent 80% less time in dashboards because there were fewer — but more actionable — metrics to review.
Key Specs: From $9/mo (10K pageviews) | <1KB script | No cookies | EU-hosted | Unlimited data retention
Pros:
- Sub-1KB script with zero Core Web Vitals impact
- No cookies or consent banners required — GDPR compliant by default
- Single-page dashboard reduces time-to-insight dramatically
Cons:
- No funnel analysis or advanced event tracking
- No predictive features or AI-powered insights
- Not suitable for SaaS products needing retention analytics
Real-World Usage: Plausible is ideal for content sites, blogs, marketing landing pages, and solo businesses that need traffic insights without complexity. It struggles for e-commerce teams needing checkout funnel analysis, SaaS products tracking feature adoption, or any team requiring cross-device user tracking.
Verdict: Choose Plausible if you value simplicity and privacy above everything else and your analytics needs center on traffic sources, not user journeys.
Before choosing between these tools, there’s a critical hidden variable most comparison guides ignore: how long each tool actually keeps your data.
The Hidden Trap: Data Retention vs. Cost Across Tools
Data retention is the silent differentiator among the best website analytics tools. GA4’s free tier defaults to 2-month retention for Explorations data (extendable to 14 months). Standard aggregated reports remain available, but granular user-level analysis disappears. Most users don’t discover this until they need historical data that no longer exists.
Matomo self-hosted stores data indefinitely — your server, your storage, your timeline. Matomo Cloud retention varies by plan but offers far longer windows than GA4 Free. Plausible and Fathom both provide unlimited retention on every paid plan, with data stored in EU data centers.
The cost comparison makes the trade-off stark: $0/year for GA4, but you lose granular data after 2–14 months. $108/year for Plausible, and you keep everything forever. $26+/month for Matomo Cloud with extended retention. Or $50,000+/year for GA360 to get 50-month retention within Google’s ecosystem.
| Tool | Free Tier Retention | Paid Retention | Annual Cost (Unlimited) | Data Location |
|---|---|---|---|---|
| GA4 Free | 2 months (default) / 14 months (configured) | N/A (free only) | N/A | US (Google servers) |
| GA360 | N/A | Up to 50 months | ~$50,000+ | US (Google servers) |
| Matomo (Self-Hosted) | Unlimited | Unlimited | $60–240 (hosting only) | Your server |
| Matomo Cloud | Varies by plan | Extended | From $312/year | EU (Frankfurt) |
| Plausible | N/A (no free tier) | Unlimited | From $108/year | EU |
| Fathom | N/A (no free tier) | Unlimited | From $168/year | EU + US options |
Google Analytics 4 retains a dominant ~44% market share, but its default 2-month data retention window means businesses lose historical insights unless they upgrade to GA360.
This retention analysis highlights a broader truth: the “best” analytics tool depends entirely on what you value most. Here’s how all the top tools compare side by side.
Quick Comparison: Top Website Analytics Tools at a Glance
The following table compares seven leading analytics tools across the criteria that matter most for your decision: use case fit, starting price, privacy compliance, data retention, and key limitations. Each cell contains verified specifics — not marketing language.
| Tool | Best For | Starting Price | Privacy/GDPR | Data Retention | Key Limitation |
|---|---|---|---|---|---|
| GA4 | Google Ads optimization | Free | Requires Consent Mode v2 | 2–14 months (free) | Steep learning curve |
| Matomo | Data sovereignty | Free (self-hosted) / $26/mo (Cloud) | GDPR compliant (self-hosted) | Unlimited (self-hosted) | Requires server skills |
| Plausible | Simple, privacy-first | $9/mo | GDPR compliant, no cookies | Unlimited | No funnels or deep events |
| Fathom | Multi-site agencies | $14/mo | GDPR compliant, no cookies | Unlimited | Higher starting price |
| Microsoft Clarity | Free behavior analytics | Free | Requires consent in EU | Unlimited | No traffic/acquisition data |
| Hotjar | User feedback + heatmaps | Free (35 sessions/day) / €32/mo | Requires consent | Varies by plan | Expensive at scale |
| Mixpanel | SaaS product analytics | Free (1M events/mo) | Configurable | Varies by plan | Complex setup for non-technical users |
Pricing verified Q1 2026. Check vendor sites for current rates.
If your tools budget anchors your decision, check out how analytics platforms pair with top SEO automation platforms for a more complete marketing stack. For teams tracking organic search performance, our guide to best SEO reporting tools covers the dedicated platforms that turn ranking data into client-ready reports.
If budget is your primary constraint, the free tools in this table deserve a closer look — but “free” comes with important caveats.
Best Free Website Analytics Tools Worth Using
From experience: I chose Plausible for NextGrowth.ai because the lightweight script (under 1KB) does not slow page load. After running GA4 for 6 months, the 2-month data retention limit and complex event setup pushed me to explore simpler alternatives.
The best free website analytics tools in 2026 include GA4, Microsoft Clarity, and self-hosted Matomo — but each defines “free” differently. Roughly 10% of users actively refuse cookies according to Statista consumer cookie consent data, while another third accept everything without reading, creating significant data reliability gaps for cookie-dependent tools. Understanding what “free” actually costs you matters more than the price tag.
GA4 Free Tier: What You Actually Get (and Lose)
GA4’s free tier is genuinely powerful for teams that understand its boundaries. You get real-time reporting, acquisition channel breakdowns, event-based tracking, limited predictive metrics, native Google Ads integration, and direct Looker Studio connectivity. For basic marketing analytics, this covers 80% of what most small businesses need.
- What GA4 Free includes:
- Real-time reporting and audience demographics
- Event tracking (up to 500 distinct events, 25 parameters per event)
- Google Ads and Search Console integration
- Looker Studio dashboards
- Predictive metrics (purchase probability, churn probability)
- What GA4 Free limits or excludes:
- 2-month default data retention (configurable to 14 months)
- 10 million events per month before sampling kicks in
- No SLA, no dedicated support
- BigQuery export capped at 1 million events per day
- Data stored on Google servers, used for ad ecosystem improvement
The hidden cost is your data itself. GA4’s free tier isn’t charity — your visitor behavior feeds Google’s advertising machine learning models. For businesses in regulated industries (finance, healthcare, EU e-commerce), this data usage creates compliance exposure that a $0 price tag can’t offset.
Here’s the real-world trap: a small SaaS startup uses GA4 Free to run a six-month growth experiment. At month seven, they want to compare Q1 baseline data against Q2 performance in Explorations. But if they left retention at the 2-month default, months one through four have been deleted. No historical benchmark exists. The lesson: either configure 14-month retention immediately, set up monthly BigQuery exports, or accept that your historical data has an expiration date.
For teams using GA4 alongside competitive research, our SEO competitor analysis framework helps structure the data you do retain into actionable insights.
If GA4’s data limitations concern you but your budget is genuinely $0, Microsoft Clarity offers a compelling alternative — especially for understanding user behavior.
Microsoft Clarity: Free Behavior Analytics Without Traffic Limits

Microsoft Clarity, a completely free behavior analytics tool with unlimited traffic and no data caps, stands alone in the analytics market. No paid tier exists. No premium upsell. No event limits. Microsoft funds Clarity through its Azure cloud ecosystem, not through monetizing your analytics data.
Microsoft Clarity processes unlimited pageviews at zero cost — the only major analytics platform with no traffic caps, no paid tiers, and no data sampling on its free plan.
Core features include click heatmaps, scroll heatmaps, session recordings, rage click detection (automatically flags when users click repeatedly on unresponsive elements), dead click detection, and excessive scrolling alerts. In 2025, Clarity added AI-powered grouped session insights that can summarize patterns across up to 250 recordings at once.
Clarity integrates natively with GA4, creating a powerful free combination. You can filter Clarity session recordings by GA4 segments — for example, “show me recordings of users who abandoned checkout” or “replay sessions from organic traffic that bounced.”
The limitations are clear: Clarity provides no traffic analytics. It doesn’t tell you where visitors come from, how many you have, or which pages rank. It’s designed as a companion tool, not a replacement for GA4 or Plausible. Filtering options are also less mature than Hotjar’s, and the integration ecosystem is narrower.
An e-commerce team pairs GA4 for traffic sources with Clarity for behavior. Clarity’s rage click detection reveals that 23% of mobile users repeatedly tap a non-clickable product image. They add a lightbox gallery — and mobile conversions increase by 15%. Total analytics cost: $0.
Key Specs: Free (no paid tier) | Unlimited sessions + heatmaps | Rage click + dead click detection | Native GA4 integration
Pros:
- Genuinely free with no usage limits — no paid tier, no sampling
- Rage click and dead click detection surface UX problems automatically
- Native GA4 integration creates a powerful $0 analytics stack
Cons:
- No traffic or acquisition analytics (behavior-only)
- No funnel analysis or e-commerce conversion tracking
- Fewer integrations and filtering options than Hotjar
Real-World Usage: Clarity works best as a complement to a traffic analytics tool. It excels at diagnosing specific conversion problems — broken forms, confusing navigation, misleading UI elements — through visual evidence. It struggles as a standalone solution because it can’t answer “how many visitors do I get?” or “which channels drive revenue?”
Verdict: Pair Clarity with any traffic analytics tool (GA4, Plausible, or Matomo) for a complete picture. On its own, it answers “why” but never “how many.”
Both GA4 and Clarity are free in different ways — one gives you traffic data, the other shows you behavior. But neither solves the underlying question: what does “free” actually cost you?
Free vs. “Free”: Understanding the True Cost of Analytics
Not all free analytics tools operate on the same business model. Understanding the distinction prevents surprises six months into your implementation.
| Type | Example | Annual Cost | What You Trade |
|---|---|---|---|
| Ad-subsidized free | GA4 | $0 | Your data feeds Google’s ad models |
| Self-hosted free | Matomo On-Premise | $60–240 (hosting) | Your time for server maintenance |
| Genuinely free | Microsoft Clarity | $0 | Limited to behavior analytics only |
The ad-subsidized model (GA4) costs nothing in dollars but trades your visitors’ behavioral data for Google’s machine learning training. The self-hosted model (Matomo) is free in license cost but requires $5–20/month in hosting and ongoing server maintenance. The genuinely free model (Clarity) charges nothing and doesn’t monetize your data — but only covers behavior analytics, not traffic.
If privacy and data ownership are non-negotiable, skip “free” entirely and invest in a purpose-built privacy-first platform.
For teams where compliance isn’t just a preference but a legal requirement, the next category of tools eliminates privacy concerns by design.
Privacy-First Analytics: GDPR-Compliant Alternatives That Skip the Cookie Banner
Privacy-first analytics tools eliminate GDPR compliance risk at the architectural level — no cookies, no personal data collection, no transatlantic data transfers. For EU-facing businesses, these platforms represent a legal necessity after multiple European data authorities ruled standard Google Analytics configurations non-compliant. Choosing a privacy-first tool is increasingly a business advantage, not just a regulatory checkbox.
Why Privacy-First Analytics Matter in 2026
The French data protection authority (CNIL) ruled that standard Google Analytics configurations violate GDPR Article 44 due to US data transfers, according to an IAPP report on CNIL’s ruling. Austria, Italy, and Denmark issued similar findings. For EU-facing businesses, running GA4 in its default configuration carries documented legal risk.
The French data protection authority (CNIL) ruled that standard Google Analytics configurations violate GDPR Article 44 due to US data transfers — making privacy-first alternatives a legal necessity, not just a preference, for EU-facing businesses.
Beyond legal exposure, ad blocker adoption now affects roughly 31.5% of internet users aged 16–64 worldwide (Backlinko, citing GWI data). GA4’s client-side tracking loses all data from these visitors. Privacy-first tools using server-side or first-party tracking architectures capture traffic that GA4 misses entirely.
Cookie consent banners introduce additional friction. The ICO guidance on analytics cookies confirms analytics cookies are not “strictly necessary” and require active user consent under PECR and GDPR. Cookieless tools eliminate this banner entirely — improving user experience while capturing 100% of consenting traffic.
A European SaaS company discovered that 35% of their developer audience used ad blockers. GA4 reported 10,000 monthly visitors; after adding Plausible’s cookieless tracking, the actual number was 15,400. That 5,400-visitor gap represented attribution data GA4 could never capture.
Now that the “why” is clear, here’s how the three leading privacy-first platforms compare on features, pricing, and compliance depth.
Plausible vs. Fathom vs. Matomo: The Privacy Tool Showdown
All three platforms deliver GDPR compliance, but they target different audiences with different trade-offs. According to Matomo’s GDPR compliance analysis, self-hosted Matomo offers 100% data ownership — ensuring compliance where standard GA4 configurations fall short due to US server transfers.
| Feature | Plausible | Fathom | Matomo Cloud |
|---|---|---|---|
| Starting Price | $9/mo (10K pageviews) | $14/mo (100K pageviews) | $26/mo |
| Cookies Required | No | No | Optional (configurable) |
| Data Location | EU | EU + US options | EU (Frankfurt) |
| Feature Depth | Basic (traffic only) | Moderate (events added) | Full (GA4-comparable) |
| Best For | Content sites, blogs | Multi-site agencies | Teams wanting GA4 depth + privacy |
Plausible is the minimalist choice. At $9/month for 10,000 pageviews, it offers the lowest entry point, the smallest script (<1KB), and the simplest dashboard. You sacrifice depth — no funnels, limited event tracking — in exchange for privacy and speed.
Fathom recently added detailed event tracking, narrowing the gap with larger platforms. At $14/month for 100,000 pageviews (10x Plausible’s base volume), it offers strong value for agencies managing multiple sites — unlimited sites come with every plan. Its higher starting price is offset by the generous pageview allocation.
- Quick Specs: Fathom Analytics
- Pros: Unlimited data retention on all plans, lightweight script (improves Core Web Vitals), ad-blocker bypassing capability, intuitive single-page dashboard.
- Cons: No free tier, limited filtering compared to GA4, basic e-commerce features.
- Real-World Usage: Fathom is the preferred choice for agencies and freelancers managing multiple client sites because of its unified dashboard and unlimited site allowance. It excels for content sites where site speed is critical for SEO.
Matomo Cloud at $26+/month delivers near-GA4 feature parity: funnels, goals, a tag manager, and optional heatmap add-ons. It targets teams who want enterprise-depth analytics without sending data to US servers. The trade-off is complexity and cost — it’s the most expensive and has the steepest learning curve of the three.
None of these is universally “better.” Plausible serves simplicity seekers. Fathom serves agencies. Matomo serves teams wanting full feature depth with data ownership.
All three tools solve the cookie consent problem, but they still rely on client-side tracking — which ad blockers can still defeat. Server-side tracking addresses this final gap.
Server-Side Tracking: How to Beat Ad Blockers in 2026
Server-side tracking (sending analytics data through your own server before forwarding it to your analytics provider, rather than relying on browser-based JavaScript tags) solves the ad blocker problem that affects roughly 31% of internet users.
Think of it as a mail forwarding service. Instead of the analytics company picking up data directly from your visitor’s browser — which ad blockers intercept because they recognize the destination (e.g., google-analytics.com) — your server picks it up first and forwards it privately. Ad blockers see traffic going to “yoursite.com,” not to a known tracking domain.
Why it matters: client-side GA4 tracking loses all visitors using ad blockers. Server-side tracking can capture 95%+ of actual traffic because ad blockers cannot distinguish analytics requests from normal page requests when they route through your own domain.
How to set up server-side tracking (simplified):
- Set up a subdomain — Create something like analytics.yoursite.com
- Point it to your analytics provider — Plausible and Fathom support custom domain proxying (CNAME setup). Matomo self-hosted is inherently server-side. GA4 requires a Google Tag Manager Server-Side Container hosted on Google Cloud (~$50–100/month for small sites).
- Update your tracking script — Replace the default analytics domain with your subdomain. Ad blockers now see “yoursite.com” traffic — tracking restored.
The implementation complexity varies. Plausible’s CNAME proxy takes 15 minutes. Matomo self-hosted requires no changes — it’s server-side by default. GA4’s server-side container requires Google Cloud expertise and ongoing hosting costs.
Server-side tracking solves the technical gap, but the regulatory question remains: which tracking approach does your specific regulation require?
The Privacy Compliance Decision Tree: GDPR vs. CCPA vs. HIPAA
Privacy regulations aren’t one-size-fits-all. The right analytics tool depends on which laws apply to your business, your visitors, and your data handling practices. The official Google Consent Mode v2 documentation outlines how GA4 adapts tag behavior based on user consent for CCPA-covered businesses, but this approach doesn’t satisfy all regulatory frameworks.
Here’s the simplified decision logic:
- Serve EU visitors? → You need cookieless analytics or explicit consent. Best options: Plausible, Fathom, or Matomo self-hosted.
- EU visitors + need cross-device tracking? → Matomo self-hosted (with consent mode configured) is likely your only compliant option with this capability.
- US-only, CCPA applies? → GA4 with Consent Mode v2 can work. Configure ad_storage and analytics_storage parameters.
- Healthcare/HIPAA? → Matomo self-hosted with a Business Associate Agreement (BAA) is one of few analytics options. Most commercial analytics tools don’t offer HIPAA compliance.
- No regulated data? → Any tool works. Choose based on features and budget.
This decision tree provides general guidance only. Consult a privacy attorney for compliance advice specific to your jurisdiction and business model.
Privacy and cost matter, but they only tell you about your traffic numbers. The next category of tools answers a fundamentally different question: why are users behaving the way they do?
User Behavior Analytics: Heatmaps, Session Recordings, and the “Why” Behind Your Data
Behavior analytics tools answer the question traffic analytics cannot: why users leave your site without converting. Instead of aggregate numbers like “60% bounce rate,” heatmaps and session recordings provide visual evidence — exactly where users clicked, how far they scrolled, and where they got frustrated. According to a Contentsquare UX analytics guide, enterprise UX platforms use zone-based heatmaps to visualize precisely where users engage, moving beyond simple pageview metrics.
Why Traffic Numbers Alone Aren’t Enough
Traffic tools like GA4, Matomo, and Plausible tell you what happened — 1,000 visitors, 60% bounce rate, 2.3 pages per session. They don’t tell you why the bounce rate is 60%. Did users fail to find what they needed? Was the call-to-action invisible on mobile? Did a form field break in Safari?
Behavior analytics tools like Hotjar and Microsoft Clarity answer the question traffic analytics cannot: why users leave your site without converting — using visual evidence like heatmaps and session recordings instead of aggregate numbers.
Behavior analytics fills this gap with three types of visual evidence. Heatmaps overlay color gradients on your page showing where users click and scroll most. Session recordings replay actual user journeys — watching a real visitor work through your checkout flow. Rage-click detection flags moments of frustration automatically, without you reviewing individual recordings.
These tools are complementary, not competitive. The best analytics stacks combine both types: GA4 (or Plausible) for traffic data + Hotjar (or Clarity) for behavior = full-picture analytics.
A marketing team sees a landing page with 5,000 visitors and a 2% conversion rate. GA4 can’t explain why 98% didn’t convert. A Hotjar heatmap reveals 70% of clicks land on a non-clickable hero image — users think it’s a button. They add a button. Conversion jumps to 4.2%. The heatmap provided the “why” that traffic data alone could never surface.
Two tools dominate this category: Hotjar (the established leader) and Microsoft Clarity (the free challenger). Here’s how they compare.
Hotjar vs. Microsoft Clarity: Visual Analytics Head-to-Head
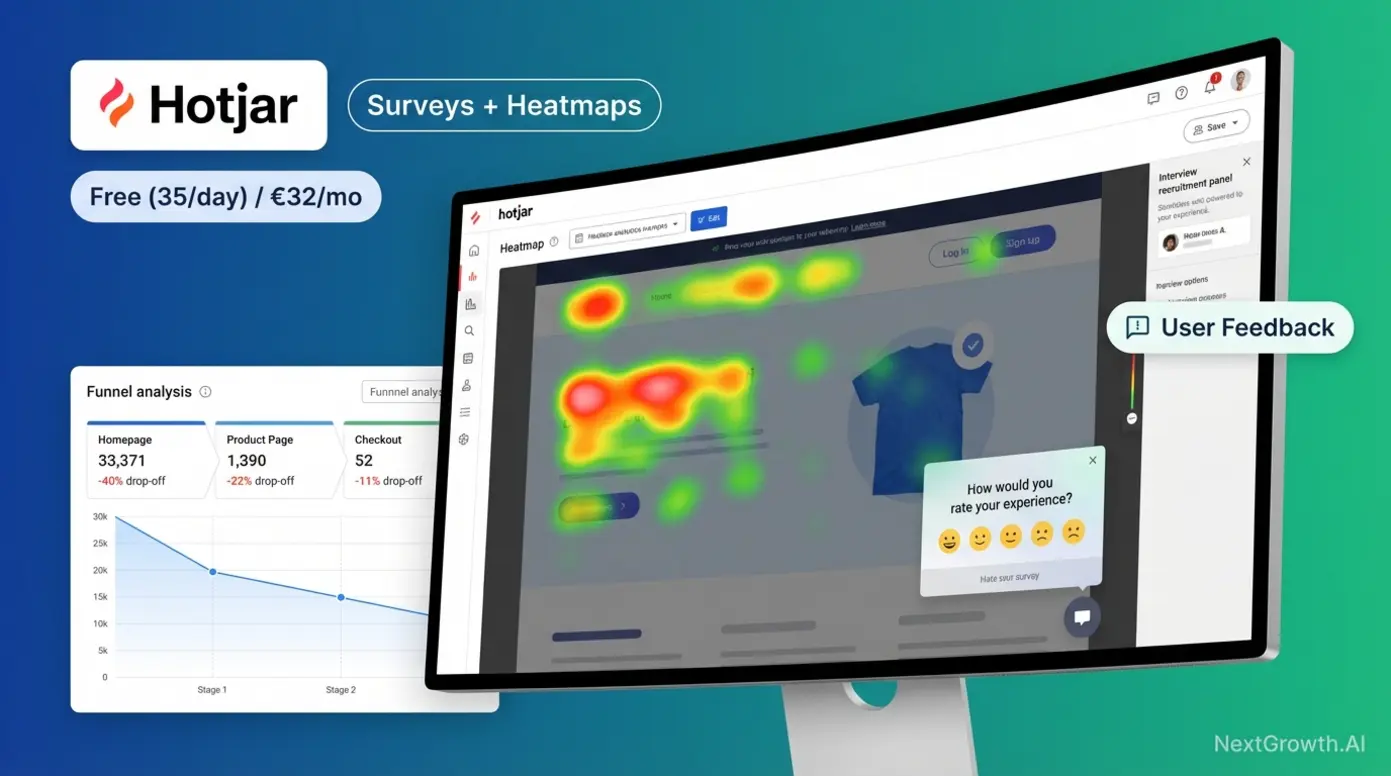
Hotjar, a behavior analytics platform known for its heatmaps, session recordings, and user feedback surveys, is the category leader — now part of Contentsquare. Microsoft Clarity is the free alternative that has closed the feature gap significantly since its 2020 launch.
| Feature | Hotjar | Microsoft Clarity |
|---|---|---|
| Price | Free (35 sessions/day) / €32/mo (Plus) | Free (no paid tier) |
| Session Recordings | Limited by plan | Unlimited |
| Heatmaps | Click, scroll, move | Click, scroll, rage, attention |
| Surveys & Feedback | Yes (unique advantage) | No |
| Rage Click Detection | No (manual identification) | Yes (automatic) |
| GA4 Integration | Via segments | Native |
Hotjar’s defining advantage is its feedback tools. On-page surveys, feedback widgets, and user interview recruitment are features Clarity doesn’t offer at all. If you need to ask users why they behaved a certain way — not just observe their behavior — Hotjar is the only option. Established integrations with Slack, HubSpot, and Zapier add workflow value.
- Quick Specs: Hotjar
- Pros: Comprehensive qualitative tools (surveys, interviews, feedback widgets), intuitive heatmap interface, long data retention on paid plans, strong segmentation capabilities.
- Cons: Free tier is very restrictive (35 daily sessions), costs escalate quickly for high-traffic sites, no real-time data processing.
- Real-World Usage: UX researchers use Hotjar to recruit users for interviews and gather direct feedback on new features. E-commerce teams use its funnel tracking to pinpoint exactly where users drop off during checkout.
The cost curve is Hotjar’s weakness. The free tier caps at 35 tracked sessions per day (roughly 1,050 monthly). The Plus plan at €32/month bumps this to 100 daily sessions. Business starts at €80/month for 500 daily sessions. For high-traffic sites, costs escalate quickly.
Microsoft Clarity offers unlimited everything for free — unlimited sessions, unlimited heatmaps, unlimited recordings. Its automatic rage-click and dead-click detection surface UX problems without manual review. The native GA4 integration creates a user-friendly pairing that lets you jump from GA4 traffic segments directly into Clarity session replays.
Clarity’s limitations are narrower integrations, less mature filtering, and — critically — no survey or feedback capability. You can see what users do, but you can’t ask them why.
Choose Hotjar if you need user feedback, surveys, or have budget for a premium behavior tool. Choose Clarity if you want free behavior analytics or already use GA4 and want a zero-cost companion.
Hotjar and Clarity excel at showing what happens on a page, but neither tracks behavior across multiple sessions over time — that’s where combining these tools with traffic analytics becomes essential.
Combining Quantitative and Qualitative Data for Full-Picture Analytics
The ideal analytics stack combines quantitative data (traffic numbers, conversion rates, acquisition channels) with qualitative data (heatmaps, session recordings, user feedback). Quantitative tells you “what” and “how many.” Qualitative tells you “why.”
Microsoft Clarity integrates directly with GA4, letting you filter session recordings by GA4 segments. For example, you can view recordings of users who abandoned checkout, replay sessions from organic traffic that bounced, or watch how mobile users from paid campaigns interact with your pricing page. Hotjar offers similar segment-based filtering through its own audience tools.
Here are recommended analytics stacks by budget:
- $0/year: GA4 + Microsoft Clarity (traffic + behavior, entirely free)
- $108/year: Plausible ($9/mo) + Clarity (free) — privacy-first traffic + free behavior
- $300+/year: Matomo Cloud ($26/mo) + Hotjar Plus (€32/mo) — data ownership + surveys
- Enterprise: GA360 + Contentsquare — predictive analytics + advanced UX analysis
No competitor provides pre-built analytics stack recommendations by budget — this framework helps you stop evaluating individual tools and start assembling a complete system.
These stacks work for marketing-focused analytics. But if you’re building a SaaS product or app, you need an entirely different type of tool — one designed for event-based product analytics.
Product Analytics for SaaS: Event Tracking, Retention, and Growth Metrics
Product analytics tools track individual user actions across sessions — measuring feature adoption, retention cohorts, and conversion funnels — while traditional web analytics tools only measure aggregate pageviews and traffic sources. If you’re building a SaaS product, this distinction determines whether you can answer the question that matters most: are users getting value from what you’ve built?
Web Analytics vs. Product Analytics: What’s the Difference?
For SaaS product teams, the critical split is between pageview-based analytics (GA4, Plausible, Matomo) and event-based analytics (Mixpanel, Amplitude, Heap). The tools look similar on the surface but answer fundamentally different questions.
| Criteria | Web Analytics | Product Analytics |
|---|---|---|
| Data Model | Pageview-based | Event-based |
| Tracks | Traffic sources, page views, bounce rate | User actions, feature usage, retention |
| Answers | “Where do visitors come from?” | “What do users DO inside the product?” |
| Best For | Marketing teams, content sites | Product managers, growth teams |
| Example Tools | GA4, Plausible, Matomo | Mixpanel, Amplitude, Heap |
GA4 did add event tracking, blurring the line. But GA4’s event model is retrofitted onto a pageview architecture. Mixpanel and Amplitude are event-native — built from the ground up for behavioral cohort analysis, retention curves, and funnel optimization that GA4 handles awkwardly.
A marketing team uses GA4 to see that 5,000 users signed up this month. The product team uses Mixpanel to discover that only 1,200 (24%) completed onboarding, and users who activated Feature X within 48 hours showed 3x higher 30-day retention. GA4 cannot surface this level of in-product behavioral insight.
With the distinction clear, here’s how the two leading product analytics platforms compare for SaaS teams.
Mixpanel vs. Amplitude: Event-Based Analytics for Growth Teams
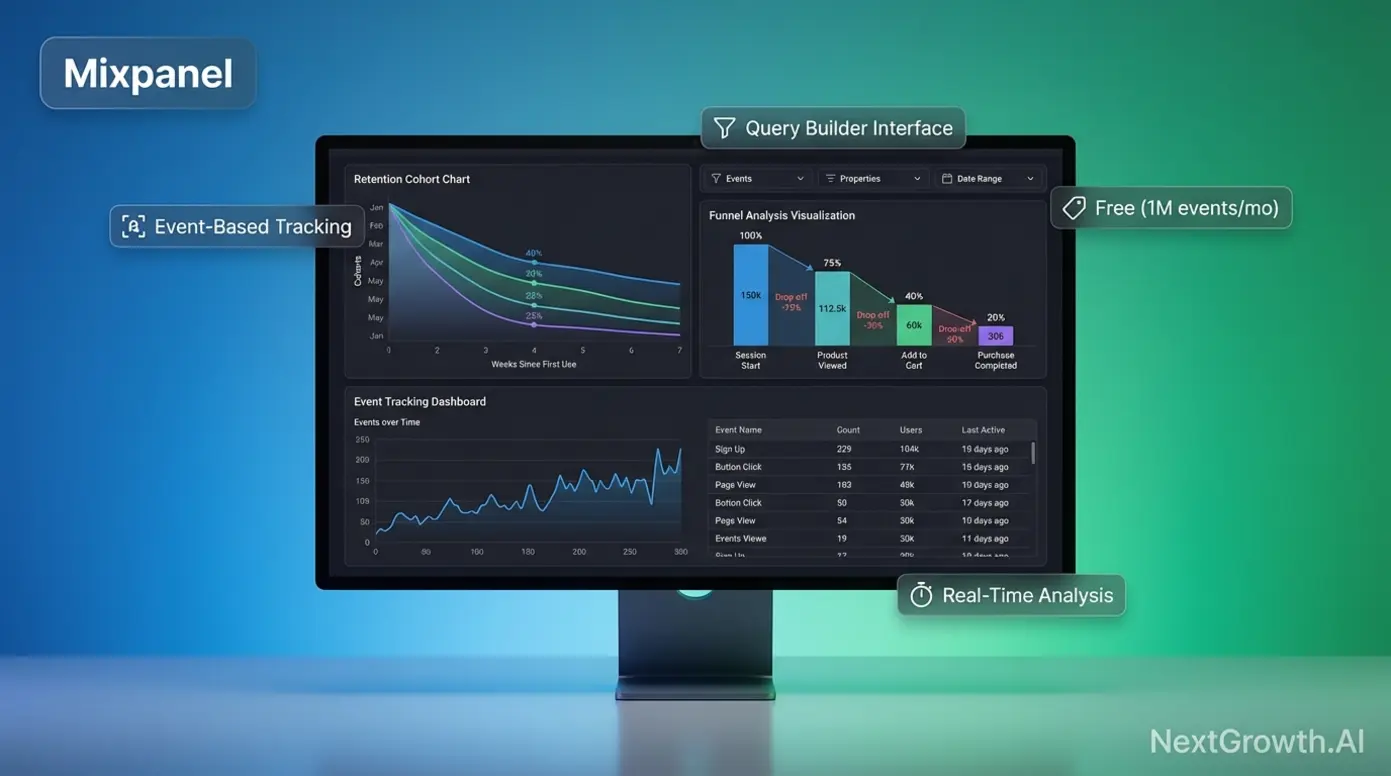
Mixpanel, an event-based product analytics platform designed for SaaS and mobile app teams, and Amplitude, an enterprise-grade product analytics platform specializing in behavioral cohort analysis, serve overlapping audiences with different philosophies.
Mixpanel offers a generous free tier: 1 million events per month with no expiration. The Growth plan includes the first 1M events free, then charges approximately $0.28 per 1,000 additional events — so 2 million monthly events costs roughly $280. Enterprise pricing is custom, typically starting around $25,000/year.
- Quick Specs: Mixpanel
- Pros: Intuitive query builder (PM-friendly), real-time data analysis, generous free tier (20M events/mo), strong mobile app tracking support.
- Cons: Advanced data governance features locked behind expensive tiers, less reliable behavioral cohorting than Amplitude.
- Real-World Usage: Product Managers at B2B startups use Mixpanel to track feature adoption rates and build simple funnels to see where users drop off during onboarding—all without needing SQL skills.
Mixpanel’s strength is self-serve usability. Product managers can build funnels, run retention analysis, and create cohorts without writing SQL. The query builder is intuitive enough that non-technical PMs consistently cite it as a reason for choosing Mixpanel over Amplitude.
Amplitude offers a free Starter plan supporting up to 50,000 monthly tracked users with core analytics. The Plus plan starts at approximately $49/month. Growth and Enterprise tiers are custom-priced, typically ranging from $5,000 to $70,000+ annually depending on usage and features.
- Quick Specs: Amplitude
- Pros: Deepest behavioral cohort analysis in the market, native data warehouse sync (Snowflake/BigQuery), advanced predictive analytics and experimentation features.
- Cons: Steep learning curve for non-analysts, complex setup required, expensive for high-volume consumer apps.
- Real-World Usage: Data science teams at large enterprises use Amplitude to run complex A/B tests and analyze long-term retention correlations across millions of users, often piping data directly to their data warehouse.
Amplitude’s strength is enterprise data architecture. Deep behavioral cohort analysis, advanced statistical modeling, experiment analysis, and native data warehouse integrations (Snowflake, BigQuery) make it the preferred choice for teams with dedicated data analysts, as noted in PostHog’s product analytics comparison.
| Feature | Mixpanel | Amplitude |
|---|---|---|
| Free Tier | 1M events/month | 50K tracked users/month |
| Paid Starting Price | ~$0.28/1K events (Growth) | ~$49/mo (Plus) |
| Best For | Mid-market SaaS, self-serve PMs | Enterprise, data analyst teams |
| Key Strength | Intuitive query builder | Advanced cohort + warehouse sync |
| Key Weakness | Limited enterprise data architecture | Steeper learning curve |
A 30-person SaaS startup chooses Mixpanel for its free 1M event tier and simple funnel builder — the product manager answers “Why do users drop off at Step 3 of onboarding?” without writing SQL. A 500-person enterprise with a dedicated data team chooses Amplitude for warehouse syncing and behavioral cohort analysis across three product lines.
For teams needing custom data infrastructure beyond what Mixpanel or Amplitude provide, DataForSEO’s developer-focused API platform offers a complementary approach to building analytics pipelines from raw data.
Need programmatic access to SEO data? Check our best SEO API comparison.
Both tools serve SaaS teams well, but the real question isn’t Mixpanel vs. Amplitude — it’s whether you’ve outgrown GA4 entirely.
When to Graduate from GA4 to Dedicated Product Analytics
Here are five signals it’s time to add product analytics:
- You need retention cohort analysis — tracking whether users return after Day 1, Day 7, Day 30
- You want to measure feature adoption rates — which features drive engagement vs. which go unused
- Your product has a multi-step onboarding flow — and you need to pinpoint where users drop off
- You need to attribute conversion to specific in-product actions — not just traffic sources
- GA4’s event tracking feels bolted-on — you’re fighting the tool instead of getting answers
You don’t necessarily need to replace GA4. Many SaaS teams run GA4 for marketing attribution alongside Mixpanel or Amplitude for product behavior. The two data types answer different questions, and running both gives you complete visibility from ad click through feature adoption.
Choosing the right analytics tool matters, but every option comes with trade-offs. Before making a final decision, consider these potential pitfalls.
What Are the Limitations of Analytics Tools, and When Should You Get Expert Help?
Common Pitfalls When Choosing Analytics Tools
Pitfall 1: Ignoring data retention policies. GA4’s 2-month default catches teams off-guard six months after implementation. By the time they need historical data for year-over-year comparisons, it’s gone. Always configure retention settings during initial setup — not after your first annual review.
Pitfall 2: Assuming “privacy-first” equals “GDPR compliant” automatically. Even Matomo requires proper configuration — IP anonymization, consent mode settings, and data processing agreements — to achieve full compliance. Self-hosting alone doesn’t guarantee GDPR conformity. Verify your configuration against current regulatory guidance.
Pitfall 3: Over-investing before product-market fit. Startups with 500 users don’t need Amplitude Enterprise at $50,000+/year. Start with free tiers (GA4 + Clarity, or Mixpanel Free), validate your analytics requirements, then scale up when usage demands it.
Pitfall 4: Underestimating implementation costs. Server-side tracking, tag management, data pipeline architecture, and BigQuery integration require engineering time. A “free” GA4 implementation with server-side containers, BigQuery exports, and Looker Studio dashboards can easily consume 40–80 hours of developer time.
Pricing, features, and compliance requirements change frequently. Verify current details on each vendor’s website before making purchasing decisions.
When to Consult a Data Analytics Professional
Not every analytics setup is a DIY project. Three scenarios where professional help pays for itself:
HIPAA or financial compliance: Cookie consent and data handling carry legal consequences. A privacy engineer can audit your implementation, draft data processing agreements, and ensure your analytics configuration doesn’t create liability.
Enterprise migration: Moving from GA360 to Matomo (or vice versa) involves data migration, historical preservation, and tag management restructuring. Professional implementation prevents data loss during the transition.
Custom data pipelines: When you need analytics data flowing from multiple tools into a data warehouse (Snowflake, BigQuery) for unified dashboards, a data engineer should architect the pipeline. The cost of misconfiguration — broken data, duplicate events, attribution errors — far exceeds the cost of expert setup.
Setting up analytics for a content blog? You can likely handle it. Configuring HIPAA-compliant tracking for a health-tech platform? Invest in professional guidance.
Frequently Asked Questions
What is the best free website analytics tool?
Google Analytics 4 (GA4) is the most comprehensive free website analytics tool, offering traffic tracking, predictive metrics, and Google Ads integration at zero cost. However, GA4’s free tier limits data retention to 2–14 months and uses your visitor data for Google’s ad ecosystem. For privacy-conscious teams, Matomo offers a free self-hosted version with full data ownership — you only pay for server hosting. Microsoft Clarity is the best free option specifically for behavior analytics, providing unlimited heatmaps and session recordings with no traffic caps. The “best” free tool depends on whether you prioritize features, privacy, or visual behavior insights.
Which website analytics tools are GDPR compliant?
Matomo, Plausible Analytics, and Fathom Analytics are among the leading GDPR-compliant website analytics tools in 2026. These platforms prioritize data privacy through cookieless tracking and full data ownership — data stays on EU servers, and no personal information is stored. This often eliminates the need for cookie consent banners entirely. GA4 can be configured for GDPR compliance using Consent Mode v2, but its default setup transfers data to US servers, which multiple EU data protection authorities — including France’s CNIL — have flagged as non-compliant with Article 44.
Is there a better alternative to Google Analytics?
The better alternative to Google Analytics depends entirely on your specific needs — no single tool replaces GA4 for all use cases. For privacy and simplicity, Plausible or Fathom outperform GA4 with cookieless, lightweight tracking and faster dashboards. For user experience insights like heatmaps and session recordings, Hotjar or Microsoft Clarity provide visual data GA4 cannot deliver. For SaaS product teams needing retention cohorts and feature-usage analytics, Mixpanel is the preferred choice. Many teams find the best approach is pairing a traffic analytics tool with a behavior analytics tool rather than seeking a single GA4 replacement.
What is the difference between web analytics and product analytics?
Web analytics tools like Google Analytics track general website traffic — page views, visitor sources, and bounce rates — to measure marketing performance and acquisition effectiveness. Product analytics tools like Mixpanel and Amplitude track specific user actions within an application — feature adoption, retention cohorts, and conversion funnels — to optimize the product experience and reduce churn. For example, web analytics might show 5,000 signups this month; product analytics reveals only 24% completed onboarding and identifies which features drive long-term retention. Most SaaS companies benefit from running both types simultaneously for complete visibility.
You generally do not need a cookie banner if you use privacy-first analytics tools like Plausible or Fathom. These platforms use anonymous, cookieless tracking that collects no personal data — eliminating the legal requirement for consent in most jurisdictions. Their scripts don’t trigger GDPR or ePrivacy Directive cookie consent rules. However, if you use Google Analytics or other cookie-dependent tools, a consent banner is legally required in the EU, UK, and an increasing number of US states with privacy legislation. Regulations vary by jurisdiction — verify your specific requirements with legal counsel.
Conclusion
For marketing teams and business owners evaluating the best website analytics tools in 2026, the right choice depends on your data philosophy, not a feature checklist. GA4 commands roughly 44% of all websites globally (W3Techs, 2026), but its data retention limits and privacy trade-offs make alternatives like Matomo, Plausible, and Mixpanel stronger fits for specific use cases. The best approach: pick your category first, then choose the tool.
The “category-first” decision framework outlined in this guide — Data Sovereignty vs. Predictive Growth vs. Behavior Analytics vs. Product Analytics — prevents the most common mistake: choosing a tool based on popularity rather than strategic fit. Combining tools (traffic + behavior) consistently outperforms any single platform. A $0 stack of GA4 + Microsoft Clarity can deliver 80% of the insights a $50,000 enterprise setup provides.
Start by identifying your category below, then take action. If privacy is your priority, trial Plausible or Matomo for 14 days. If you need ad optimization, configure GA4’s retention settings today. If you’re building a SaaS product, install Mixpanel’s SDK this week. Don’t just analyze the tools—implement the one that fits your strategy.
This guide reflects Q1 2026 pricing and features. We update this comparison quarterly — bookmark this page for the latest data.