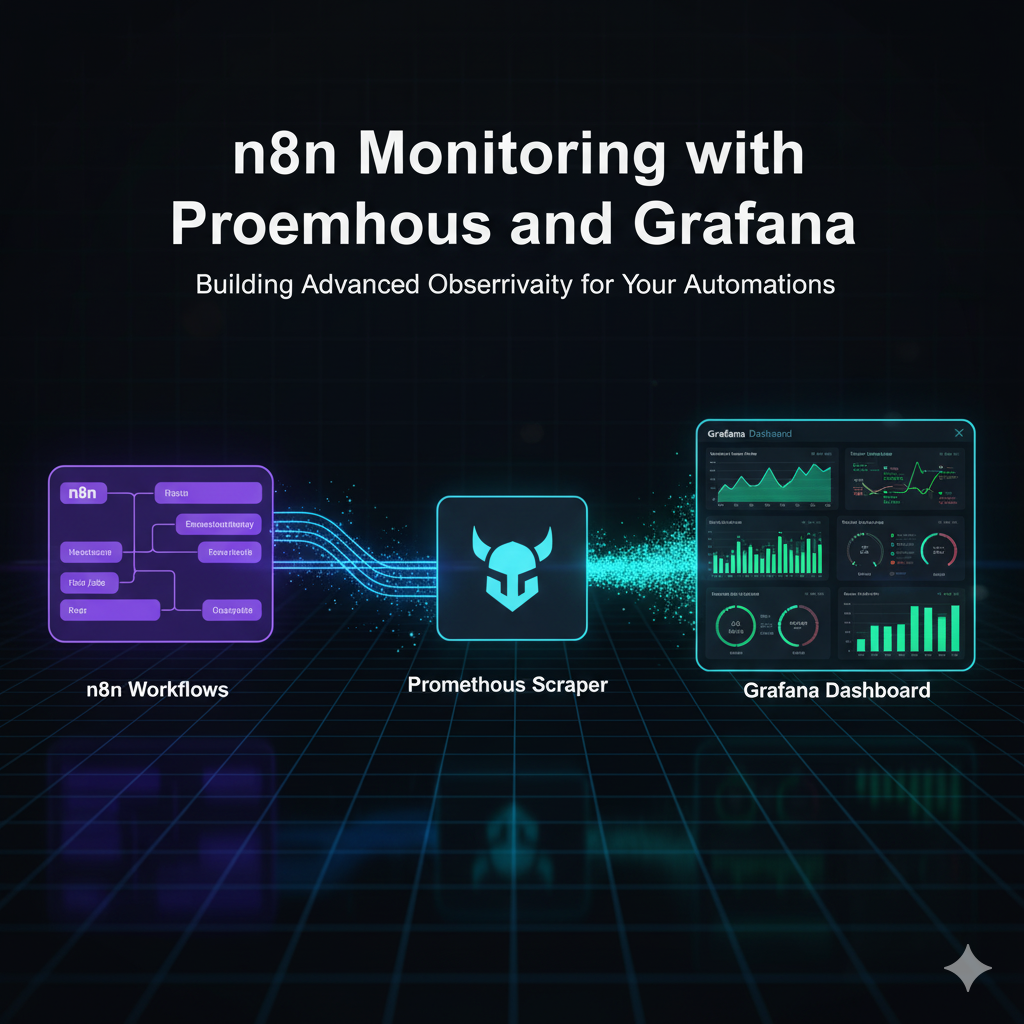
n8n Monitoring with Prometheus & Grafana on Docker Compose (Traefik, Exporters) — with One-Script Automation
Your critical n8n workflow fails silently in the middle of the night. How long does it take you to notice? An hour? A day? By then, the damage is done—customers are impacted, data is lost, and trust is eroded. Reactive troubleshooting isn’t a strategy; it’s a liability. When your automations are mission-critical, you can’t afford to be in the dark.
See our n8n keyword research automation for another practical n8n use case.
New to n8n? Start with our n8n platform guide for a full overview.
If you’ve ever asked, “How do I monitor my n8n instance?” or “How can I get alerts for failed n8n executions?”, you’re in the right place. This guide is the definitive, updated playbook for n8n monitoring, drawing on direct experience managing complex, production-grade environments. We’ll address the most common questions—from checking server status to diagnosing why a workflow is failing—and take you from a complete beginner to a pro with a fully automated monitoring and alerting system.
Forget fragmented documentation and incomplete tutorials. In this playbook, you will find:
- A One-Command Deployment: A copy-paste-ready Docker Compose file to launch a full monitoring stack (n8n, Prometheus, Grafana) in minutes.
- A Pre-Built Dashboard: A downloadable Grafana dashboard JSON, specifically designed for n8n, to visualize critical metrics immediately.
- Proactive, Automated Alerts: Step-by-step instructions for creating alerts that notify you about high memory usage and specific workflow failures the moment they happen.
- A Beginner’s Troubleshooting Checklist: A practical guide to quickly diagnosing the most common n8n errors involving authentication, webhooks, and data formatting.
By the end of this guide, you will have a production-ready monitoring system that provides clarity, control, and confidence in your automation infrastructure.
Contents
- The Starting Point: Mastering n8n’s Built-in Troubleshooting Tools
- The Production-Grade Stack: Your n8n Early Warning System
- Step-by-Step: Install n8n with Prometheus & Grafana Monitoring
- How Do You Automate n8n Monitoring with a Script?
- How Do You Visualize n8n Health and Turn Metrics into Decisions with Grafana?
- Monitoring the Foundation: Your Server Health Dashboard (Node Exporter)
- Drilling Deeper: Container Health with the cAdvisor Dashboard
- Monitoring the Front Door: Your Traefik Health Dashboard
- How Do You Set Up Automated Workflow Error Alerts to Go Proactive in n8n?
- FAQ: n8n Monitoring & Error Handling
- Resources
- Conclusion
The Starting Point: Mastering n8n’s Built-in Troubleshooting Tools
Before you can build a sophisticated monitoring system, you need to master the art of first-response diagnostics. When something breaks, the tools built directly into n8n are your first line of defense. Mastering them will help you solve the vast majority of common issues in minutes.
Why is my n8n workflow failing? Decoding the Execution Logs
Your workflow just failed. That red “Failed” status is staring back at you. Where do you even begin?
Your first and most important source of truth is the Execution Log. This is a detailed, step-by-step record of a single workflow run.
How to Read It:
- Navigate to the Executions tab in your n8n UI.
- Click on the failed run you want to investigate.
- The workflow view will appear, showing the exact path the data took. The node that caused the failure will be highlighted in red with an exclamation mark.
- Click on that red node. You can now inspect its Input, Output, and, most importantly, the Error tab to see the exact failure message.
A Rogue’s Gallery of Common Errors:
- Authentication Failures
- What it looks like: 401 Unauthorized or 403 Forbidden.
- What it usually means: The API key, password, or token you’re using for a service is incorrect, has expired, or lacks the necessary permissions for the action you’re trying to perform.
- Data Formatting Issues
- What it looks like: Cannot read properties of undefined or Input data is not an array.
- What it usually means: One node passed data in a structure that the next node didn’t expect. For example, a node was expecting a list of items to loop through but only received a single item. Use the “Input” and “Output” tabs to see exactly what data was passed between the nodes.
- Timeout Errors
- What it looks like: TIMEOUT_ERROR or 504 Gateway Timeout.
- What it usually means: An external API or service took too long to respond. This could be a temporary issue with that service, or you might be asking it to process too much data at once.
Pro-Tip: The red node is often the victim, not the culprit. The real problem frequently lies in an upstream node that sent malformed or empty data. Always trace the execution path backward from the point of failure. Inspect the output of the node before the one that failed. This single habit will help you solve most workflow issues incredibly quickly.
How do I check the n8n server status? Using the Health Check Endpoint
For a quick, automated way to confirm your n8n instance is online and responsive, you can use its built-in health endpoint.
The Command:
Simply send an HTTP GET request to this URL: your-n8n-domain.com/healthz
What the Response Means:
If your n8n server is running properly, it will return a 200 OK status code. Anything else (like a connection error or a 5xx error) indicates a problem with the core n8n service itself.
Important Caveat: This check does not tell you if your workflows are running successfully. It only confirms the server is online. Think of it as checking if the lights are on in the building, not if the actual work is getting done inside.
This simple endpoint is perfect for integrating with uptime monitoring services like UptimeRobot or for use in basic shell scripts to verify your n8n instance is alive. For more practical examples and advanced use cases, the community has had extensive discussions about these n8n health check endpoints.
The Production-Grade Stack: Your n8n Early Warning System
Manual log checks are great for solving problems after they happen. But if you’re running business-critical automations, you need to see problems coming. This is where a production-grade monitoring stack comes in—it’s the early warning system for your entire n8n environment.
This section answers some of the most common advanced questions we hear:
- “What are the best practices for monitoring n8n workflows?”
- “How can I get alerts for failed n8n executions?”
- “How do I set up Grafana and Prometheus for n8n?”
The best practice isn’t a single trick; it’s a layered approach using dedicated tools. A complete, professional monitoring solution needs to perform four key jobs:
- Collection: An agent that constantly pulls performance and health data (metrics) directly from your n8n instance.
- Storage: A high-performance time-series database (TSDB) built specifically to store this constant stream of data.
- Visualization: A dashboarding tool that turns millions of raw data points into intuitive graphs and charts you can actually understand.
- Alerting: An automated system that watches your metrics 24/7 and notifies you via Slack, email, or other channels the moment a problem is detected.
To accomplish this, we will use the industry-standard “Prometheus and Grafana” stack. Here’s a breakdown of the tools we’ll deploy and why each piece matters:
| Component | What it does | Why we need it |
| Traefik (edge) | Reverse proxy, TLS (Let’s Encrypt), routing to n8n., grafana.; optional Basic Auth for dashboards. | Secure public entrypoint on 80/443; keeps Grafana protected and simplifies domain management. |
| Postgres | Primary database for n8n (workflows, credentials, execution data). | Saturation, locks, or connection spikes directly degrade reliability; DB health must be first-class. |
| Prometheus | Pulls /metrics from n8n, Traefik, and exporters; stores time-series. | Single source of truth for operational signals; enables alerting based on real data. |
| Grafana (Dashboards & Alerting) | Visualizes key panels (success rate, p95 duration, queue depth, infra); manages alert rules and contact points. | Human-friendly operations view and notifications to Email/Slack/Telegram without exposing Prometheus. |
| Node Exporter | Host-level CPU/RAM/disk/filesystem metrics. | Detects VPS pressure and capacity limits before containers fail; informs right-sizing. |
| cAdvisor | Per-container CPU/memory/restarts metrics. | Finds “noisy neighbors,” memory leaks, and crash loops quickly. |
| Postgres Exporter | DB-specific metrics (connections, locks, cache hit, saturation). | Early warning on DB bottlenecks and misconfiguration. |
| Redis Exporter | Redis metrics (memory, evictions, ops/sec, latency). | Protects queue-mode throughput; alerts before job wait times spike. |
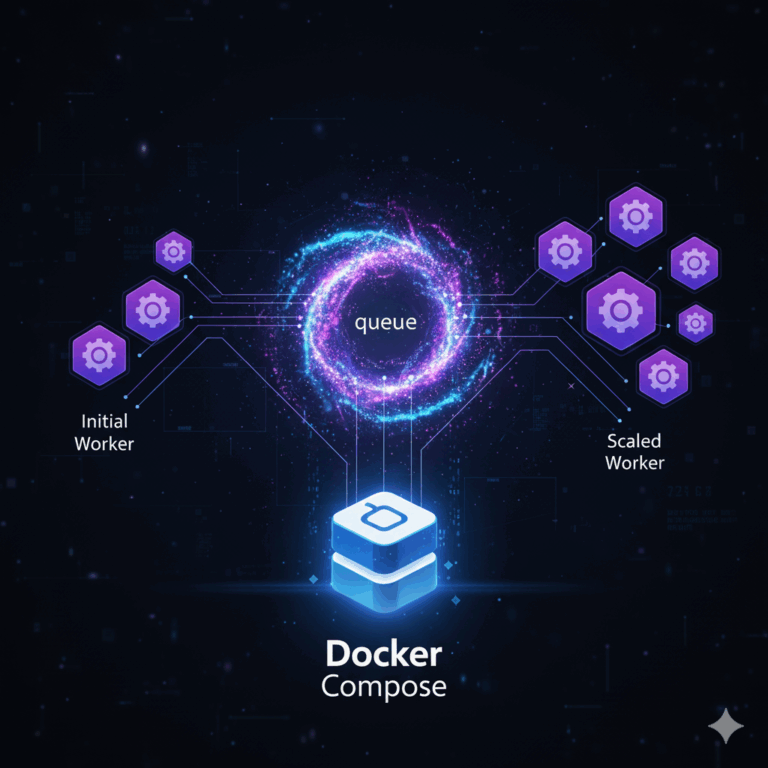
n8n Queue Mode Observability Architecture
Users reach the stack over HTTPS via Traefik, which terminates TLS and routes app traffic to n8n Main. n8n persists state in PostgreSQL and enqueues jobs in Redis; Workers and the Task Runner consume from Redis, execute workflows, and write results back to PostgreSQL.
Prometheus scrapes metrics from Traefik, n8n, and the exporters, while Grafana visualizes them on dashboards protected by Traefik Basic Auth.

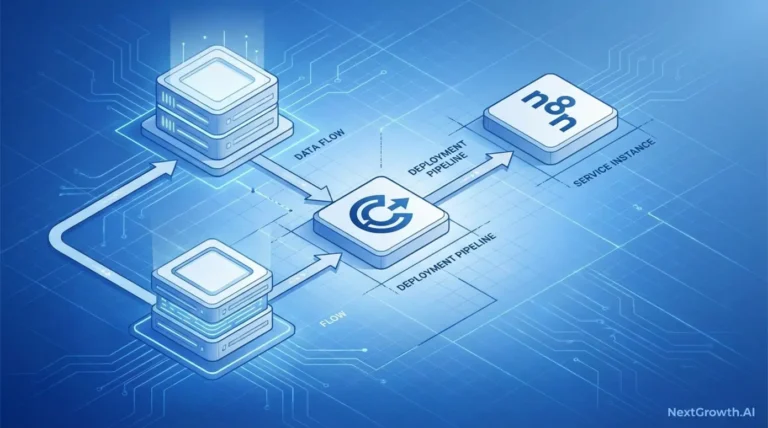
n8n Single Mode Observability Architecture

Step-by-Step: Install n8n with Prometheus & Grafana Monitoring
1. Prerequisites
Ubuntu VPS: 22.04+ recommended.
Sizing (minimums):
- Single mode: 1 vCPU, 2 GB RAM, 20 GB disk.
- Queue mode (main + workers): 2–4 vCPU, 4–8 GB RAM, 40 GB+ disk (scale workers with load).
Domain & DNS
Create DNS records pointing to your VPS public IP:
n8n.<your-domain>→ A/AAAA to server IPgrafana.<your-domain>→ A/AAAA to server IP
(Optional)prometheus.<your-domain>only if you choose to expose it (default is private).
TLS & email
- Let’s Encrypt email for Traefik (renewal notices).
- Decide notification channels for alerts: Email/SMTP, Slack, Telegram (you’ll plug these into Grafana).
2. Clone my n8n-toolkit repo
# Option 1 — Developers (Git)
git clone https://github.com/thenguyenvn90/n8n-toolkit.git
cd n8n-toolkit

# Option 2 — Download as ZIP
sudo apt update && sudo apt install -y unzip
curl -L -o n8n-toolkit.zip https://github.com/thenguyenvn90/n8n-toolkit/archive/refs/heads/main.zip
unzip n8n-toolkit.zip
cd n8n-toolkit-main

root@ubuntu-s-1vcpu-1gb-sgp1-01:~/n8n-toolkit# tree
.
├── LICENSE
├── README.md
├── common.sh
├── monitoring
│   ├── grafana
│   │   └── provisioning
│   │       ├── alerts
│   │       │   └── n8n_grafana_alerts.json
│   │       ├── dashboards
│   │       │   ├── Cadvisor-exporter-14282.json
│   │       │   ├── Node-Exporter-Full-1860.json
│   │       │   ├── PostgreSQL-Database-9628.json
│   │       │   ├── Redis-Dashboard-Prometheus-Redis-Exporter-1.x-763.json
│   │       │   ├── Traefik-2.2-12250.json
│   │       │   ├── dashboards.yml
│   │       │   ├── n8n-Essentials.json
│   │       │   ├── n8n-Queue-Mode-Health-Essentials.json
│   │       │   ├── n8n-Queue-Mode-Health-Full.json
│   │       │   ├── n8n–Queue-Mode-Health-Essentials.json
│   │       │   └── n8n–Queue-Mode-Health-Full.json
│   │       └── datasources
│   │           └── datasource.yml
│   └── prometheus.yml
├── n8n_manager.sh
├── queue-mode
│   └── docker-compose.yml
└── single-mode
    └── docker-compose.yml
3. Install Docker and Docker Compose
sudo apt update && sudo apt upgrade -y

sudo apt-get install -y ca-certificates curl gnupg lsb-release

# Add Docker’s official GPG key
sudo mkdir -p /etc/apt/keyrings
curl -fsSL https://download.docker.com/linux/ubuntu/gpg | \
  sudo gpg --dearmor -o /etc/apt/keyrings/docker.gpg

# Add the Docker repository
echo \
  "deb [arch=$(dpkg --print-architecture) signed-by=/etc/apt/keyrings/docker.gpg] \
  https://download.docker.com/linux/ubuntu $(lsb_release -cs) stable" | \
  sudo tee /etc/apt/sources.list.d/docker.list > /dev/null

# Install Docker Engine and Compose v2
sudo apt-get update
sudo apt-get install -y docker-ce docker-ce-cli containerd.io docker-compose-plugin

# Allow user to run Docker without sudo
sudo usermod -aG docker ${USER}
# Register the `docker` group membership with current session without changing your primary group
exec sg docker newgrp4. Create project and copy templates
# Create n8n target directory
sudo mkdir -p /home/n8n && sudo chown -R $USER: /home/n8n

# Copy our docker compose and .enf files
# For single mode
cp ./single-mode/docker-compose.yml /home/n8n/docker-compose.yml
cp ./single-mode/.env /home/n8n/.env

# For queue mode
cp ./queue-mode/docker-compose.yml /home/n8n/docker-compose.yml
cp ./queue-mode/.env /home/n8n/.env

# Copy the whole folder monitoring/ → /home/n8n/monitoring/
cp -R ./monitoring /home/n8n/- Example docker-compose.yml and .env file for single mode: https://github.com/thenguyenvn90/n8n-toolkit/tree/monitoring/single-mode
single-mode/docker-compose.yml
services:
  traefik:
    image: traefik:v2.11
    restart: unless-stopped
    command:
      - "--api.dashboard=false"
      # EntryPoints
      - "--entrypoints.web.address=:80"
      - "--entrypoints.web.http.redirections.entrypoint.to=websecure"
      - "--entrypoints.web.http.redirections.entrypoint.scheme=https"
      - "--entrypoints.websecure.address=:443"
      # Providers
      - "--providers.docker=true"
      - "--providers.docker.exposedbydefault=false"
      - "--providers.docker.network=n8n-network"
      # ACME (production)
      - "--certificatesresolvers.le.acme.email=${SSL_EMAIL}"
      - "--certificatesresolvers.le.acme.storage=/letsencrypt/acme.json"
      - "--certificatesresolvers.le.acme.tlschallenge=true"
      # Logs
      - "--log.level=INFO"
      - "--accesslog=true"
      # Health check
      - "--ping=true"
      - "--ping.entrypoint=traefikping"
      - "--entrypoints.traefikping.address=:8082"
      # Prometheus metrics
      - "--metrics.prometheus=true"
      - "--metrics.prometheus.addEntryPointsLabels=true"
      - "--metrics.prometheus.addRoutersLabels=true"
      - "--metrics.prometheus.addServicesLabels=true"
      - "--entrypoints.metrics.address=:8081"
      - "--metrics.prometheus.entryPoint=metrics"
    ports:
      - "80:80"
      - "443:443"
    volumes:
      - /var/run/docker.sock:/var/run/docker.sock:ro
      - letsencrypt:/letsencrypt
      - ./secrets/htpasswd:/etc/traefik/htpasswd:ro
    networks: [n8n-network]
    security_opt: [no-new-privileges:true]
    healthcheck:
      test: ["CMD", "wget", "--spider", "-q", "http://localhost:8082/ping"]
      interval: 10s
      timeout: 5s
      start_period: 20s
      retries: 5

  postgres:
    image: postgres:14
    restart: unless-stopped
    env_file: [.env]
    environment:
      - TZ=${GENERIC_TIMEZONE}
    volumes:
      - postgres-data:/var/lib/postgresql/data
    networks: [n8n-network]
    security_opt: [no-new-privileges:true]
    healthcheck:
      test: ["CMD", "pg_isready", "-U", "${POSTGRES_USER}"]
      interval: 10s
      timeout: 5s
      start_period: 20s
      retries: 5

  # n8n (single mode)
  main:
    image: docker.n8n.io/n8nio/n8n:${N8N_IMAGE_TAG:-latest}
    restart: unless-stopped
    env_file: [.env]
    environment:
      - TZ=${GENERIC_TIMEZONE}
      - N8N_METRICS=true
    volumes:
      - n8n-data:/home/node/.n8n
      - ./local-files:/files
    depends_on:
      postgres:
        condition: service_healthy
    networks: [n8n-network]
    security_opt: [no-new-privileges:true]
    healthcheck:
      test: ["CMD-SHELL", "wget --spider -q http://localhost:${N8N_PORT:-5678}/healthz || exit 1"]
      interval: 10s
      timeout: 5s
      start_period: 20s
      retries: 5
    labels:
      - "traefik.enable=true"
      - "traefik.docker.network=n8n-network"
      # Router & TLS
      - "traefik.http.routers.n8n.rule=Host(`${N8N_FQDN}`)"
      - "traefik.http.routers.n8n.entrypoints=websecure"
      - "traefik.http.routers.n8n.tls=true"
      - "traefik.http.routers.n8n.tls.certresolver=le"
      # Bind the router to the named Traefik service defined below
      - "traefik.http.routers.n8n.service=n8n"
      - "traefik.http.services.n8n.loadbalancer.server.port=${N8N_PORT:-5678}"
      # Middlewares
      - "traefik.http.routers.n8n.middlewares=n8n-headers,n8n-rate,n8n-retry,n8n-compress"
      # Security headers
      - "traefik.http.middlewares.n8n-headers.headers.stsSeconds=315360000"
      - "traefik.http.middlewares.n8n-headers.headers.browserXssFilter=true"
      - "traefik.http.middlewares.n8n-headers.headers.contentTypeNosniff=true"
      - "traefik.http.middlewares.n8n-headers.headers.forceSTSHeader=true"
      - "traefik.http.middlewares.n8n-headers.headers.stsIncludeSubdomains=true"
      - "traefik.http.middlewares.n8n-headers.headers.stsPreload=true"
      # Rate limiting
      - "traefik.http.middlewares.n8n-rate.ratelimit.average=100"
      - "traefik.http.middlewares.n8n-rate.ratelimit.burst=50"
      - "traefik.http.middlewares.n8n-rate.ratelimit.period=1s"
      # Retry & compression
      - "traefik.http.middlewares.n8n-retry.retry.attempts=3"
      - "traefik.http.middlewares.n8n-compress.compress=true"

  # ===== Monitoring (enabled by COMPOSE_PROFILES=monitoring) =====
  prometheus:
    profiles: ["monitoring"]
    image: prom/prometheus:latest
    restart: unless-stopped
    command:
      - "--config.file=/etc/prometheus/prometheus.yml"
      - "--storage.tsdb.retention.time=15d"
    volumes:
      - ./monitoring/prometheus.yml:/etc/prometheus/prometheus.yml:ro
      - prometheus-data:/prometheus
    networks: [n8n-network]
    security_opt: [no-new-privileges:true]
    labels:
      - "traefik.enable=${EXPOSE_PROMETHEUS:-false}"
      - "traefik.docker.network=n8n-network"
      - "traefik.http.routers.prom.rule=Host(`${PROMETHEUS_FQDN}`)"
      - "traefik.http.routers.prom.entrypoints=websecure"
      - "traefik.http.routers.prom.tls=true"
      - "traefik.http.routers.prom.tls.certresolver=le"
      - "traefik.http.services.prom.loadbalancer.server.port=9090"
      - "traefik.http.routers.prom.middlewares=prom-auth@docker"
      - "traefik.http.middlewares.prom-auth.basicauth.usersfile=${TRAEFIK_USERSFILE}"

  grafana:
    profiles: ["monitoring"]
    image: grafana/grafana:latest
    restart: unless-stopped
    environment:
      - TZ=${GENERIC_TIMEZONE}
      - GF_SECURITY_ADMIN_USER=admin
      - GF_SECURITY_ADMIN_PASSWORD=${MONITORING_BASIC_AUTH_PASS}
      - GF_SERVER_DOMAIN=${GRAFANA_FQDN}
      - GF_SERVER_ROOT_URL=https://${GRAFANA_FQDN}
      - GF_SERVER_ENFORCE_DOMAIN=true
      - GF_SECURITY_COOKIE_SECURE=true
      - GF_USERS_ALLOW_SIGN_UP=false
      - GF_PATHS_PROVISIONING=/etc/grafana/provisioning
    volumes:
      - grafana-data:/var/lib/grafana
      - ./monitoring/grafana/provisioning/datasources:/etc/grafana/provisioning/datasources:ro
      - ./monitoring/grafana/provisioning/dashboards:/etc/grafana/provisioning/dashboards:ro
      - ./monitoring/grafana/provisioning/alerts:/etc/grafana/provisioning/alerts:ro
    networks: [n8n-network]
    security_opt: [no-new-privileges:true]
    labels:
      - "traefik.enable=true"
      - "traefik.docker.network=n8n-network"
      - "traefik.http.routers.grafana.rule=Host(`${GRAFANA_FQDN}`)"
      - "traefik.http.routers.grafana.entrypoints=websecure"
      - "traefik.http.routers.grafana.tls=true"
      - "traefik.http.routers.grafana.tls.certresolver=le"
      - "traefik.http.services.grafana.loadbalancer.server.port=3000"
      - "traefik.http.routers.grafana.middlewares=grafana-auth@docker,secure-headers@docker"
      - "traefik.http.middlewares.grafana-auth.basicauth.usersfile=${TRAEFIK_USERSFILE}"
      - "traefik.http.middlewares.grafana-auth.basicauth.removeheader=true"
      - "traefik.http.middlewares.secure-headers.headers.stsSeconds=31536000"
      - "traefik.http.middlewares.secure-headers.headers.stsIncludeSubdomains=true"
      - "traefik.http.middlewares.secure-headers.headers.stsPreload=true"
      - "traefik.http.middlewares.secure-headers.headers.browserXssFilter=true"
      - "traefik.http.middlewares.secure-headers.headers.contentTypeNosniff=true"
    depends_on: [prometheus]

  postgres-exporter:
    profiles: ["monitoring"]
    image: quay.io/prometheuscommunity/postgres-exporter:latest
    restart: unless-stopped
    environment:
      - DATA_SOURCE_NAME=postgresql://${POSTGRES_USER}:${POSTGRES_PASSWORD}@postgres:5432/${POSTGRES_DB}?sslmode=disable
    networks: [n8n-network]
    security_opt: [no-new-privileges:true]
    depends_on:
      postgres:
        condition: service_healthy

  cadvisor:
    profiles: ["monitoring"]
    image: gcr.io/cadvisor/cadvisor:latest
    restart: unless-stopped
    privileged: true
    volumes:
      - /:/rootfs:ro
      - /var/run:/var/run:ro
      - /sys:/sys:ro
      - /var/lib/docker/:/var/lib/docker:ro
    networks: [n8n-network]
    security_opt: [no-new-privileges:true]

  node-exporter:
    profiles: ["monitoring"]
    image: prom/node-exporter:latest
    restart: unless-stopped
    pid: "host"
    networks: [n8n-network]
    volumes:
      - /proc:/host/proc:ro
      - /sys:/host/sys:ro
      - /:/rootfs:ro
    command:
      - "--path.procfs=/host/proc"
      - "--path.sysfs=/host/sys"
      - "--path.rootfs=/rootfs"
    security_opt: [no-new-privileges:true]

networks:
  n8n-network:
    name: n8n-network
    driver: bridge

volumes:
  n8n-data:
    external: true
  postgres-data:
    external: true
  letsencrypt:
    external: true
  prometheus-data:
    external: true
  grafana-data:
external: truesingle-mode/.env
# ================================================
#    ENV VARIABLES FOR SINGLE MODE & MONITORING
# ================================================

# -------- DOMAIN & FQDN --------
DOMAIN=example.com
SUBDOMAIN_N8N=n8n
SUBDOMAIN_GRAFANA=grafana
SUBDOMAIN_PROMETHEUS=prometheus
SSL_EMAIL=you@example.com
GENERIC_TIMEZONE=Asia/Ho_Chi_Minh

N8N_FQDN=${SUBDOMAIN_N8N}.${DOMAIN}
GRAFANA_FQDN=${SUBDOMAIN_GRAFANA}.${DOMAIN}
PROMETHEUS_FQDN=${SUBDOMAIN_PROMETHEUS}.${DOMAIN}

# -------- IMAGE & RUNTIME --------
N8N_IMAGE_TAG=latest
NODE_ENV=production
N8N_LOG_LEVEL=info
N8N_DIAGNOSTICS_ENABLED=false
N8N_BLOCK_ENV_ACCESS_IN_NODE=true

# -------- n8n URLS --------
N8N_PORT=5678
N8N_PROTOCOL=https
N8N_HOST=${N8N_FQDN}
WEBHOOK_URL=https://${N8N_FQDN}
N8N_EDITOR_BASE_URL=https://${N8N_FQDN}
N8N_PUBLIC_API_BASE_URL=https://${N8N_FQDN}
N8N_SECURE_COOKIE=true

# -------- SECURITY & SECRETS --------
# Generate with: openssl rand -base64 16
POSTGRES_PASSWORD=CHANGE_ME_BASE64_16_BYTES
# Generate with: openssl rand -base64 32
N8N_ENCRYPTION_KEY=CHANGE_ME_BASE64_32_BYTES
# Generate with: openssl rand -base64 16
N8N_BASIC_AUTH_PASSWORD=CHANGE_ME_BASE64_16_BYTES

N8N_ENFORCE_SETTINGS_FILE_PERMISSIONS=true
N8N_BASIC_AUTH_ACTIVE=true
N8N_BASIC_AUTH_USER=admin
# N8N_BASIC_AUTH_PASSWORD=${N8N_BASIC_AUTH_PASSWORD}

# -------- DATABASE SETTINGS --------
DB_TYPE=postgresdb
DB_POSTGRESDB_HOST=postgres
DB_POSTGRESDB_PORT=5432
DB_POSTGRESDB_DATABASE=n8n
DB_POSTGRESDB_USER=n8n
DB_POSTGRESDB_PASSWORD=${POSTGRES_PASSWORD}

POSTGRES_USER=n8n
# POSTGRES_PASSWORD=${POSTGRES_PASSWORD}
POSTGRES_DB=n8n

# -------- RUNNERS (internal) --------
N8N_RUNNERS_ENABLED=true
N8N_RUNNERS_MODE=internal
N8N_RUNNERS_MAX_CONCURRENCY=5
N8N_RUNNERS_AUTH_TOKEN=${N8N_BASIC_AUTH_PASSWORD}

# -------- EXECUTION BEHAVIOR --------
EXECUTIONS_DATA_PRUNE=true
EXECUTIONS_DATA_MAX_AGE=336
EXECUTIONS_RETRY_MAX=3

# -------- MONITORING STACK --------
COMPOSE_PROJECT_NAME=n8n
COMPOSE_PROFILES=
TRAEFIK_USERSFILE=/etc/traefik/htpasswd
MONITORING_BASIC_AUTH_USER=admin
# Grafana admin password and Traefik’s Basic Auth
MONITORING_BASIC_AUTH_PASS=StrongPass@123
EXPOSE_PROMETHEUS=false

# -------- END OF CONFIG --------- Example docker-compose.yml and .env file for queue mode: https://github.com/thenguyenvn90/n8n-toolkit/tree/monitoring/queue-mode
queue-mode/docker-compose.yml
services:
  traefik:
    image: traefik:v2.11
    restart: unless-stopped
    command:
      - "--api.dashboard=false"
      # EntryPoints
      - "--entrypoints.web.address=:80"
      - "--entrypoints.web.http.redirections.entrypoint.to=websecure"
      - "--entrypoints.web.http.redirections.entrypoint.scheme=https"
      - "--entrypoints.websecure.address=:443"
      # Providers
      - "--providers.docker=true"
      - "--providers.docker.exposedbydefault=false"
      - "--providers.docker.network=n8n-network"
      # ACME (production)
      - "--certificatesresolvers.le.acme.email=${SSL_EMAIL}"
      - "--certificatesresolvers.le.acme.storage=/letsencrypt/acme.json"
      - "--certificatesresolvers.le.acme.tlschallenge=true"
      # Logs
      - "--log.level=INFO"
      - "--accesslog=true"
      # Health check
      - "--ping=true"
      - "--ping.entrypoint=traefikping"
      - "--entrypoints.traefikping.address=:8082"
      # Prometheus metrics
      - "--metrics.prometheus=true"
      - "--metrics.prometheus.addEntryPointsLabels=true"
      - "--metrics.prometheus.addRoutersLabels=true"
      - "--metrics.prometheus.addServicesLabels=true"
      - "--entrypoints.metrics.address=:8081"
      - "--metrics.prometheus.entryPoint=metrics"
    ports:
      - "80:80"
      - "443:443"
    volumes:
      - /var/run/docker.sock:/var/run/docker.sock:ro
      - letsencrypt:/letsencrypt
      - ./secrets/htpasswd:/etc/traefik/htpasswd:ro
    networks: [n8n-network]
    security_opt: [no-new-privileges:true]
    healthcheck:
      test: ["CMD", "wget", "--spider", "-q", "http://localhost:8082/ping"]
      interval: 10s
      timeout: 5s
      start_period: 10s
      retries: 5

  postgres:
    image: postgres:14
    restart: unless-stopped
    env_file: [.env]
    environment:
      - TZ=${GENERIC_TIMEZONE}
    volumes:
      - postgres-data:/var/lib/postgresql/data
    networks: [n8n-network]
    security_opt: [no-new-privileges:true]
    healthcheck:
      test: ["CMD", "pg_isready", "-U", "${POSTGRES_USER}"]
      interval: 10s
      timeout: 5s
      start_period: 10s
      retries: 5

  redis:
    image: redis:7
    restart: unless-stopped
    environment:
      - TZ=${GENERIC_TIMEZONE}
    command: ["redis-server", "--requirepass", "${REDIS_PASSWORD}"]
    volumes:
      - redis-data:/data
    networks: [n8n-network]
    security_opt: [no-new-privileges:true]
    healthcheck:
      test: ["CMD", "redis-cli", "-a", "${REDIS_PASSWORD}", "ping"]
      interval: 10s
      timeout: 10s
      start_period: 10s
      retries: 5

  # Main (UI, schedules, webhooks)
  main:
    image: docker.n8n.io/n8nio/n8n:${N8N_IMAGE_TAG:-latest}
    restart: unless-stopped
    env_file: [.env]
    environment:
      - TZ=${GENERIC_TIMEZONE}
      - N8N_METRICS=true
      - N8N_METRICS_INCLUDE_QUEUE_METRICS=true
    volumes:
      - n8n-data:/home/node/.n8n
      - ./local-files:/files
    depends_on:
      postgres:
        condition: service_healthy
      redis:
        condition: service_healthy
    healthcheck:
      test: ["CMD-SHELL", "wget --spider -q http://localhost:${N8N_PORT:-5678}/healthz || exit 1"]
      interval: 10s
      timeout: 5s
      start_period: 20s
      retries: 5
    labels:
      - "traefik.enable=true"
      - "traefik.docker.network=n8n-network"
      # Router & TLS
      - "traefik.http.routers.n8n.rule=Host(`${N8N_FQDN}`)"
      - "traefik.http.routers.n8n.entrypoints=websecure"
      - "traefik.http.routers.n8n.tls=true"
      - "traefik.http.routers.n8n.tls.certresolver=le"
      # Traefik 'service' label name
      - "traefik.http.routers.n8n.service=main"
      - "traefik.http.services.main.loadbalancer.server.port=${N8N_PORT:-5678}"
      # Middlewares
      - "traefik.http.routers.n8n.middlewares=n8n-headers,n8n-rate,n8n-retry,n8n-compress"
      - "traefik.http.middlewares.n8n-headers.headers.stsSeconds=315360000"
      - "traefik.http.middlewares.n8n-headers.headers.browserXssFilter=true"
      - "traefik.http.middlewares.n8n-headers.headers.contentTypeNosniff=true"
      - "traefik.http.middlewares.n8n-headers.headers.forceSTSHeader=true"
      - "traefik.http.middlewares.n8n-headers.headers.stsIncludeSubdomains=true"
      - "traefik.http.middlewares.n8n-headers.headers.stsPreload=true"
      - "traefik.http.middlewares.n8n-rate.ratelimit.average=100"
      - "traefik.http.middlewares.n8n-rate.ratelimit.burst=50"
      - "traefik.http.middlewares.n8n-rate.ratelimit.period=1s"
      - "traefik.http.middlewares.n8n-retry.retry.attempts=3"
      - "traefik.http.middlewares.n8n-compress.compress=true"
    networks: [n8n-network]
    security_opt: [no-new-privileges:true]

  # External Task Runner for n8n-main
  runner-main:
    image: docker.n8n.io/n8nio/n8n:${N8N_IMAGE_TAG}
    restart: unless-stopped
    env_file: [.env]
    environment:
      - TZ=${GENERIC_TIMEZONE}
    entrypoint: ["/usr/local/bin/task-runner-launcher"]
    command: ["javascript"]
    depends_on:
      main:
        condition: service_started
      redis:
        condition: service_healthy
    networks: [n8n-network]
    security_opt: [no-new-privileges:true]

  # Worker(s) – scale horizontally
  worker:
    image: docker.n8n.io/n8nio/n8n:${N8N_IMAGE_TAG:-latest}
    restart: unless-stopped
    env_file: [.env]
    environment:
      - TZ=${GENERIC_TIMEZONE}
    command: ["worker", "--concurrency=${N8N_WORKER_CONCURRENCY}"]
    volumes:
      - n8n-data:/home/node/.n8n
      - ./local-files:/files
    depends_on:
      postgres:
        condition: service_healthy
      redis:
        condition: service_healthy
    networks: [n8n-network]
    security_opt: [no-new-privileges:true]

  # ===== Monitoring (profile) =====
  prometheus:
    profiles: ["monitoring"]
    image: prom/prometheus:latest
    restart: unless-stopped
    command:
      - "--config.file=/etc/prometheus/prometheus.yml"
      - "--storage.tsdb.retention.time=15d"
    volumes:
      - ./monitoring/prometheus.yml:/etc/prometheus/prometheus.yml:ro
      - prometheus-data:/prometheus
    networks: [n8n-network]
    security_opt: [no-new-privileges:true]
    labels:
      - "traefik.enable=${EXPOSE_PROMETHEUS:-false}"
      - "traefik.docker.network=n8n-network"
      - "traefik.http.routers.prom.rule=Host(`${PROMETHEUS_FQDN}`)"
      - "traefik.http.routers.prom.entrypoints=websecure"
      - "traefik.http.routers.prom.tls=true"
      - "traefik.http.routers.prom.tls.certresolver=le"
      - "traefik.http.services.prom.loadbalancer.server.port=9090"
      - "traefik.http.routers.prom.middlewares=prom-auth@docker"
      - "traefik.http.middlewares.prom-auth.basicauth.usersfile=${TRAEFIK_USERSFILE}"

  grafana:
    profiles: ["monitoring"]
    image: grafana/grafana:latest
    restart: unless-stopped
    environment:
      - TZ=${GENERIC_TIMEZONE}
      - GF_SECURITY_ADMIN_USER=admin
      - GF_SECURITY_ADMIN_PASSWORD=${MONITORING_BASIC_AUTH_PASS}
      - GF_SERVER_DOMAIN=${GRAFANA_FQDN}
      - GF_SERVER_ROOT_URL=https://${GRAFANA_FQDN}
      - GF_SERVER_ENFORCE_DOMAIN=true
      - GF_SECURITY_COOKIE_SECURE=true
      - GF_USERS_ALLOW_SIGN_UP=false
      - GF_PATHS_PROVISIONING=/etc/grafana/provisioning
    volumes:
      - grafana-data:/var/lib/grafana
      - ./monitoring/grafana/provisioning/datasources:/etc/grafana/provisioning/datasources:ro
      - ./monitoring/grafana/provisioning/dashboards:/etc/grafana/provisioning/dashboards:ro
      - ./monitoring/grafana/provisioning/alerts:/etc/grafana/provisioning/alerts:ro
    networks: [n8n-network]
    security_opt: [no-new-privileges:true]
    labels:
      - "traefik.enable=true"
      - "traefik.docker.network=n8n-network"
      - "traefik.http.routers.grafana.rule=Host(`${GRAFANA_FQDN}`)"
      - "traefik.http.routers.grafana.entrypoints=websecure"
      - "traefik.http.routers.grafana.tls=true"
      - "traefik.http.routers.grafana.tls.certresolver=le"
      - "traefik.http.services.grafana.loadbalancer.server.port=3000"
      # PROXY BASIC AUTH (usersFile)
      - "traefik.http.routers.grafana.middlewares=grafana-auth@docker,secure-headers@docker"
      - "traefik.http.middlewares.grafana-auth.basicauth.usersfile=${TRAEFIK_USERSFILE}"
      - "traefik.http.middlewares.grafana-auth.basicauth.removeheader=true"
      # Optional hardening (HSTS, XSS protection, etc.)
      - "traefik.http.middlewares.secure-headers.headers.stsSeconds=31536000"
      - "traefik.http.middlewares.secure-headers.headers.stsIncludeSubdomains=true"
      - "traefik.http.middlewares.secure-headers.headers.stsPreload=true"
      - "traefik.http.middlewares.secure-headers.headers.browserXssFilter=true"
      - "traefik.http.middlewares.secure-headers.headers.contentTypeNosniff=true"
    depends_on: [prometheus]

  postgres-exporter:
    profiles: ["monitoring"]
    image: quay.io/prometheuscommunity/postgres-exporter:latest
    restart: unless-stopped
    environment:
      - DATA_SOURCE_NAME=postgresql://${POSTGRES_USER}:${POSTGRES_PASSWORD}@postgres:5432/${POSTGRES_DB}?sslmode=disable
    networks: [n8n-network]
    security_opt: [no-new-privileges:true]
    depends_on:
      postgres:
        condition: service_healthy

  redis-exporter:
    profiles: ["monitoring"]
    image: oliver006/redis_exporter:latest
    restart: unless-stopped
    command:
      - "--redis.addr=redis:6379"
      - "--redis.password=${REDIS_PASSWORD}"
    networks: [n8n-network]
    security_opt: [no-new-privileges:true]
    depends_on:
      redis:
        condition: service_healthy

  cadvisor:
    profiles: ["monitoring"]
    image: gcr.io/cadvisor/cadvisor:latest
    restart: unless-stopped
    privileged: true
    volumes:
      - /:/rootfs:ro
      - /var/run:/var/run:ro
      - /sys:/sys:ro
      - /var/lib/docker/:/var/lib/docker:ro
    networks: [n8n-network]
    security_opt: [no-new-privileges:true]

  node-exporter:
    profiles: ["monitoring"]
    image: prom/node-exporter:latest
    restart: unless-stopped
    pid: "host"
    networks: [n8n-network]
    volumes:
      - /proc:/host/proc:ro
      - /sys:/host/sys:ro
      - /:/rootfs:ro
    command:
      - "--path.procfs=/host/proc"
      - "--path.sysfs=/host/sys"
      - "--path.rootfs=/rootfs"
    security_opt: [no-new-privileges:true]

networks:
  n8n-network:
    name: n8n-network
    driver: bridge

volumes:
  n8n-data:
    external: true
  postgres-data:
    external: true
  redis-data:
    external: true
  letsencrypt:
    external: true
  prometheus-data:
    external: true
  grafana-data:
external: truequeue-mode/.env
# ================================================
#    ENV VARIABLES FOR QUEUE MODE & MONITORING
# ================================================

# -------- DOMAIN & FQDN --------
DOMAIN=example.com
SUBDOMAIN_N8N=n8n
SUBDOMAIN_GRAFANA=grafana
SUBDOMAIN_PROMETHEUS=prometheus
SSL_EMAIL=you@example.com
GENERIC_TIMEZONE=Asia/Ho_Chi_Minh

N8N_FQDN=${SUBDOMAIN_N8N}.${DOMAIN}
GRAFANA_FQDN=${SUBDOMAIN_GRAFANA}.${DOMAIN}
PROMETHEUS_FQDN=${SUBDOMAIN_PROMETHEUS}.${DOMAIN}

# -------- IMAGE & RUNTIME --------
N8N_IMAGE_TAG=latest
NODE_ENV=production
N8N_LOG_LEVEL=info
N8N_DIAGNOSTICS_ENABLED=false
N8N_BLOCK_ENV_ACCESS_IN_NODE=true

# -------- n8n URLS --------
N8N_PORT=5678
N8N_PROTOCOL=https
N8N_HOST=${N8N_FQDN}
WEBHOOK_URL=https://${N8N_FQDN}
N8N_EDITOR_BASE_URL=https://${N8N_FQDN}
N8N_PUBLIC_API_BASE_URL=https://${N8N_FQDN}
N8N_SECURE_COOKIE=true
# Enable Metrics
N8N_METRICS=true
N8N_METRICS_INCLUDE_QUEUE_METRICS=true

# -------- SECURITY & SECRETS --------
# Generate with: openssl rand -base64 16
POSTGRES_PASSWORD=CHANGE_ME_BASE64_16_BYTES
# Generate with: openssl rand -base64 16
REDIS_PASSWORD=CHANGE_ME_BASE64_16_BYTES
# Generate with: openssl rand -base64 32
N8N_ENCRYPTION_KEY=CHANGE_ME_BASE64_32_BYTES
# Generate with: openssl rand -base64 16
N8N_BASIC_AUTH_PASSWORD=CHANGE_ME_BASE64_16_BYTES

N8N_ENFORCE_SETTINGS_FILE_PERMISSIONS=true
N8N_BASIC_AUTH_ACTIVE=true
N8N_BASIC_AUTH_USER=admin
# N8N_BASIC_AUTH_PASSWORD=${N8N_BASIC_AUTH_PASSWORD}

# -------- DATABASE SETTINGS --------
DB_TYPE=postgresdb
DB_POSTGRESDB_HOST=postgres
DB_POSTGRESDB_PORT=5432
DB_POSTGRESDB_DATABASE=n8n
DB_POSTGRESDB_USER=n8n
DB_POSTGRESDB_PASSWORD=${POSTGRES_PASSWORD}

POSTGRES_USER=n8n
# POSTGRES_PASSWORD=${POSTGRES_PASSWORD}
POSTGRES_DB=n8n

# -------- QUEUE MODE --------
EXECUTIONS_MODE=queue
QUEUE_BULL_REDIS_HOST=redis
QUEUE_BULL_REDIS_PORT=6379
QUEUE_BULL_REDIS_PASSWORD=${REDIS_PASSWORD}
OFFLOAD_MANUAL_EXECUTIONS_TO_WORKERS=true
QUEUE_HEALTH_CHECK_ACTIVE=true

# Workers scaling
N8N_WORKER_CONCURRENCY=5
N8N_WORKER_SCALE=2

# -------- EXTERNAL RUNNERS --------
N8N_RUNNERS_ENABLED=true
N8N_RUNNERS_MODE=external
N8N_RUNNERS_BROKER_LISTEN_ADDRESS=0.0.0.0
N8N_RUNNERS_MAX_CONCURRENCY=5
N8N_RUNNERS_AUTH_TOKEN=${N8N_BASIC_AUTH_PASSWORD}

# -------- EXECUTION SETTINGS --------
EXECUTIONS_TIMEOUT=3600
EXECUTIONS_DATA_PRUNE=true
EXECUTIONS_DATA_MAX_AGE=336
EXECUTIONS_RETRY_MAX=3

# -------- MONITORING STACK --------
COMPOSE_PROJECT_NAME=n8n
COMPOSE_PROFILES=
TRAEFIK_USERSFILE=/etc/traefik/htpasswd
MONITORING_BASIC_AUTH_USER=admin
# Grafana admin password and Traefik’s Basic Auth
MONITORING_BASIC_AUTH_PASS=StrongPass@123
EXPOSE_PROMETHEUS=false

# -------- END OF CONFIG --------5. Launch the n8n stack
- Create the htpasswd file on the host
# Create the directory (on the HOST)
sudo install -d -m 0750 /etc/traefik

# Create the file with your first user (bcrypt)
# You'll be prompted for the password
sudo apt-get update && sudo apt-get install -y apache2-utils
sudo htpasswd -cB /etc/traefik/htpasswd admin

# Tighten permissions
sudo chmod 640 /etc/traefik/htpasswd- Update .env file
# Navigate to project directory
cd /home/n8n

# Generate strong secrets (paste results into .env):
# 16-byte base64 for passwords
openssl rand -base64 16
# 32-byte base64 for encryption key
openssl rand -base64 32

# Update information to /home/n8n/.env
nano .env

# Base & subdomains
DOMAIN=example.com
SUBDOMAIN_N8N=n8n
SUBDOMAIN_GRAFANA=grafana
SUBDOMAIN_PROMETHEUS=prometheus

# (Optional, if your compose reads them directly)
N8N_FQDN=n8n.${DOMAIN}
GRAFANA_FQDN=grafana.${DOMAIN}
PROMETHEUS_FQDN=prometheus.${DOMAIN}

# Let's Encrypt email
SSL_EMAIL=you@example.com

# n8n version tag (pin if you want a fixed version)
N8N_IMAGE_TAG=latest

# Enable monitoring profile
COMPOSE_PROFILES=monitoring
# Public Prometheus? (true/false)
EXPOSE_PROMETHEUS=false

# Strong secrets — generate new ones below (don’t use these examples)
POSTGRES_PASSWORD=<base64-16>
N8N_BASIC_AUTH_PASSWORD=<base64-16>
N8N_ENCRYPTION_KEY=<base64-32>

# Traefik Basic Auth protecting Grafana/Prometheus
TRAEFIK_USERSFILE=/etc/traefik/htpasswd

# Then save the .env file
- Validate the docker compose and bring stacks up
# Create a directory called local-files for sharing files between the n8n instance and the host system
mkdir -p ./local-files
# Let your host user own the folder; n8n runs as user 1000 in the container
chown -R ${SUDO_USER:-$USER}:${SUDO_USER:-$USER} ./local-files
chmod 755 ./local-files

# Validate YAML & env expansion first
docker compose config

# Pull images (optional but recommended)
docker compose pull

# Manual create volume
docker volume create n8n-data
docker volume create postgres-data
docker volume create letsencrypt

# Monitoring
docker volume create grafana-storage
docker volume create prometheus-data
# If you choose queue mode, add:
docker volume create redis-data

# Seed the ACME file inside letsencrypt
docker run --rm -v letsencrypt:/data alpine \
  sh -c "touch /data/acme.json && chmod 600 /data/acme.json"

# Confirm all volumes created
docker volume ls | grep -E 'n8n-data|postgres-data|letsencrypt|grafana-storage|prometheus-data|redis-data'

# Start n8 stacks
docker compose up -d- Health Checks & Sanity Testing
# Check if all Docker containers running and healthy
docker ps -a --format 'table {{.Names}}\t{{.Image}}\t{{.Status}}\t{{.Ports}}'

# If any container is not healthy, check the container logs

docker compose logs -f traefik
docker compose logs -f n8n
docker compose logs -f postgres
docker compose logs -f grafana
docker compose logs -f prometheus
docker compose logs -f redis     # if used

# Or: One-shot (no follow), grouped by container:
docker ps -q | xargs -I{} sh -c 'echo "===== {} ====="; docker logs --tail=200 {}'

# Or: Live stream for every running container, merged with name prefix:
# This will prefix each line with the container name, making merged logs easier to read.
for c in $(docker ps -q); do
    n=$(docker inspect -f '{{.Name}}' "$c" | sed 's#^/##')
    docker logs -f --tail=0 "$c" | sed "s/^/[$n] /" &
done; wait6. Accessing Dashboards
Login to Grafana at https://grafana.domain.com with your basic auth.
- First prompt: Traefik basic auth (user/password from secrets/htpasswd).
- Then Grafana login: admin / ${GRAFANA_ADMIN_PASSWORD}.
- In Grafana, go to Dashboards → Import, search by ID or paste JSON.
Recommended dashboards:
| Service | Dashboard Name | Grafana Dashboard ID | Link |
|---|---|---|---|
| n8n | n8n Queue Mode (Full) | (see JSON under dashboard directory) | |
| Traefik | Traefik v2 Metrics | 12250 | Traefik 2.x Dashboard |
| PostgreSQL | PostgreSQL Database | 9628 | Postgres Exporter Dashboard |
| Redis | Redis Dashboard for Prometheus | 763 | Redis Dashboard |
| Node Exporter | Node Exporter Full | 1860 | Node Exporter Full |
| cAdvisor | cAdvisor Exporter Dashboard | 14282 | cAdvisor Dashboard |
How to import:
- Go to Grafana → Dashboards → Import.
- Enter the Dashboard ID from the table above.
- Select your Prometheus datasource.
- Click Import.
Example how to import a Grafana Dashboard

How Do You Automate n8n Monitoring with a Script?
If you don’t want to stitch Compose files and provisioning by hand, use the n8n Manager script to install, secure, and operate the whole stack (n8n + Prometheus + Grafana + exporters) in one go. It follows the same architecture in this guide and bakes in health checks, TLS, and sane defaults.
What the script automates
- Install / Upgrade the full stack on Ubuntu (Docker + Compose, volumes, pinned tags).
- Monitoring profile: Prometheus, Grafana, Node Exporter, cAdvisor, Postgres/Redis exporters, Traefik metrics.
- Security: Let’s Encrypt TLS via Traefik, dashboards behind Basic Auth, Prometheus kept private (opt-in to expose).
- Mode-aware: single or queue mode
- Ops workflows: backup (local + optional rclone to Drive), restore, and cleanup with safety checks.
Command line overview:
./n8n_manager.sh -h
Usage: ./n8n_manager.sh [ONE ACTION] [OPTIONS]

Actions (choose exactly one):
  -a, --available
        List available n8n versions

  -i, --install <DOMAIN>
        Install n8n with the given base domain (e.g., example.com)
        Optional: --mode single|queue  (default: single)
        Optional: -v|--version <tag>

  -u, --upgrade
        Upgrade n8n to target version (or latest). Domain/FQDNs are read from .env.

  -b, --backup
        Run backup (skip if no changes unless -f)

  -r, --restore <FILE_OR_REMOTE>
        Restore from local file or rclone remote (e.g. gdrive:folder/file.tar.gz)

  -c, --cleanup [safe|all]  Stop stack & remove resources (preview; confirm in 'all')

Options:
  --mode <single|queue>     (install only; default: single)
  -v, --version <tag>       Target n8n version (default: latest stable)
  -m, --ssl-email <email>   LE certificate email (install/upgrade)
  -d, --dir <path>          Target n8n directory (default: /home/n8n)
  -l, --log-level <LEVEL>   DEBUG | INFO (default) | WARN | ERROR
  -f, --force               Upgrade: allow downgrade or redeploy; Backup: force even if unchanged
  -e, --email-to <email>    Send notifications to this address (requires SMTP_USER/SMTP_PASS env)
  -n, --notify-on-success   Also email on success (not just failures)
  -s, --remote-name <name>  rclone remote root (e.g. gdrive-user or gdrive-user:/n8n-backups)
  -h, --help                Show this help

# Monitoring-related (install-time):
  --monitoring                        Enable Prometheus/Grafana profile
  --expose-prometheus                 Expose Prometheus publicly (default: private)
  --subdomain-n8n <sub>               Override n8n subdomain (default: n8n)
  --subdomain-grafana <sub>           Override Grafana subdomain (default: grafana)
  --subdomain-prometheus <sub>        Override Prometheus subdomain (default: prometheus)
  --basic-auth-user <user>            Traefik basic auth user for Grafana/Prometheus
  --basic-auth-pass <pass>            Traefik basic auth pass for Grafana/Prometheus

Examples:
  ./n8n_manager.sh -a
      # List available versions

  ./n8n_manager.sh --install example.com -m you@example.com
      # Install the latest n8n version with single mode

  ./n8n_manager.sh --install example.com -m you@example.com -v 1.105.3 --mode queue
      # Install a specific n8n version with queue mode

  ./n8n_manager.sh --install example.com -m you@example.com -d /path/to/n8n --mode queue
      # Install the latest n8n version (queue mode) to a specific target directory

  ./n8n_manager.sh --install example.com -m you@example.com --mode queue --monitoring --basic-auth-user admin --basic-auth-pass 'StrongPass@123'
      # Install the latest n8n version (queue mode) with monitoring (Grafana + Prometheus)

  ./n8n_manager.sh --upgrade
      # Upgrade to the latest n8n version (domain/FQDNs read from .env)

  ./n8n_manager.sh --upgrade -f -v 1.107.2
      # Upgrade to a specific n8n version

  ./n8n_manager.sh --backup --remote-name gdrive-user --email-to ops@example.com --notify-on-success
      # Backup and upload to Google Drive, notify via email

  ./n8n_manager.sh --restore backups/your_backup_file.tar.gz
# Restore with the tar.gz file at localInstall n8n single mode with monitoring
Use the script n8n_manager.sh to deploy the latest n8n single mode plus the full observability stack in one shot.
# Install the latest n8n version (single mode) with monitoring
./n8n_manager.sh --install example.com -m you@example.com --mode single --monitoring --basic-auth-user admin --basic-auth-pass "StrongPass@123"What it deploys:
- n8n (single container) behind Traefik (HTTPS + Basic Auth for dashboards)
- PostgreSQL
- Prometheus (private), Grafana (public behind Basic Auth)
- Exporters: Node Exporter, cAdvisor, Postgres Exporter, Traefik metrics.
# Logs after the installation finishs:
═════════════════════════════════════════════════════════════
N8N has been successfully installed!
Installation Mode:       single
Domain (n8n):            https://n8n.example.com
Grafana:                 https://grafana.example.com
Prometheus:              (internal only)
Installed Version:       1.111.0
Install Timestamp:       2025-09-09_23-41-53
Installed By:            root
Target Directory:        /home/n8n
SSL Email:               you@example.com
Execution log:           /home/n8n/logs/install_n8n_2025-09-09_23-41-53.log
═════════════════════════════════════════════════════════════Access to the https://grafana.example.com with user=admin; password is=StrongPass@123

Install n8n queue mode with monitoring
Deploys n8n main and workers backed by Redis (BullMQ) with full observability.
# Install the latest n8n version (queue mode with 2 workers) with monitoring
./n8n_manager.sh --install example.com -m you@example.com --mode queue --monitoring --basic-auth-user admin --basic-auth-pass "StrongPass@123"What it deploys:
- n8n Main (editor/API) + 2 n8n Workers (execute jobs)
- Redis (BullMQ) for the queue
- PostgreSQL
- Prometheus (private), Grafana (public behind Basic Auth)
- Exporters: Node, cAdvisor, Postgres Exporter, Redis Exporter, Traefik metrics
# Logs after the installation finishs:
═════════════════════════════════════════════════════════════
N8N has been successfully installed!
Installation Mode:       queue
Domain (n8n):            https://n8n.example.com
Grafana:                 https://grafana.example.com
Prometheus:              (internal only)
Installed Version:       1.111.0
Install Timestamp:       2025-09-09_15-22-05
Installed By:            root
Target Directory:        /home/n8n
SSL Email:               you@example.com
Execution log:           /home/n8n/logs/install_n8n_2025-09-09_15-22-05.log
═════════════════════════════════════════════════════════════Read more about n8n queue mode manual setup here.
How Do You Visualize n8n Health and Turn Metrics into Decisions with Grafana?
Prometheus is now collecting thousands of data points every minute from your n8n instance, but numbers in a database are just noise. To turn that data into decisions, you need to see the patterns, trends, and warning signs at a glance. This is where your n8n Grafana dashboard comes in, transforming raw metrics into a clear, visual story about your system’s health.
Your Pre-Built n8n Dashboard: From Zero to Insight in 60 Seconds
Building a comprehensive dashboard from scratch takes hours of tweaking queries and arranging panels. To save you the effort, we’ve built one for you that’s ready for immediate n8n performance monitoring.
This pre-configured JSON file contains all the panels and queries needed to visualize the most critical n8n metrics. Instead of starting from a blank screen, you can have a complete dashboard in the time it takes to upload a file.
Here’s how to import it:
- Navigate to your Grafana instance (access to https://grafana.example.com with user=admin; password is=StrongPass@123)
- In the left-hand menu, go to Dashboards.
- Click the New button in the top right and select Import.
- Upload our provided JSON files or paste its contents into the text box.
- Choose your Prometheus data source from the dropdown and click Import.
Instantly, your screen will populate with real-time graphs and stats from your n8n instance.
This board gives operators a single place to confirm service health, reliability, performance, and capacity—and it points directly to the next action: example fix a failing workflow, add workers, or add resources.
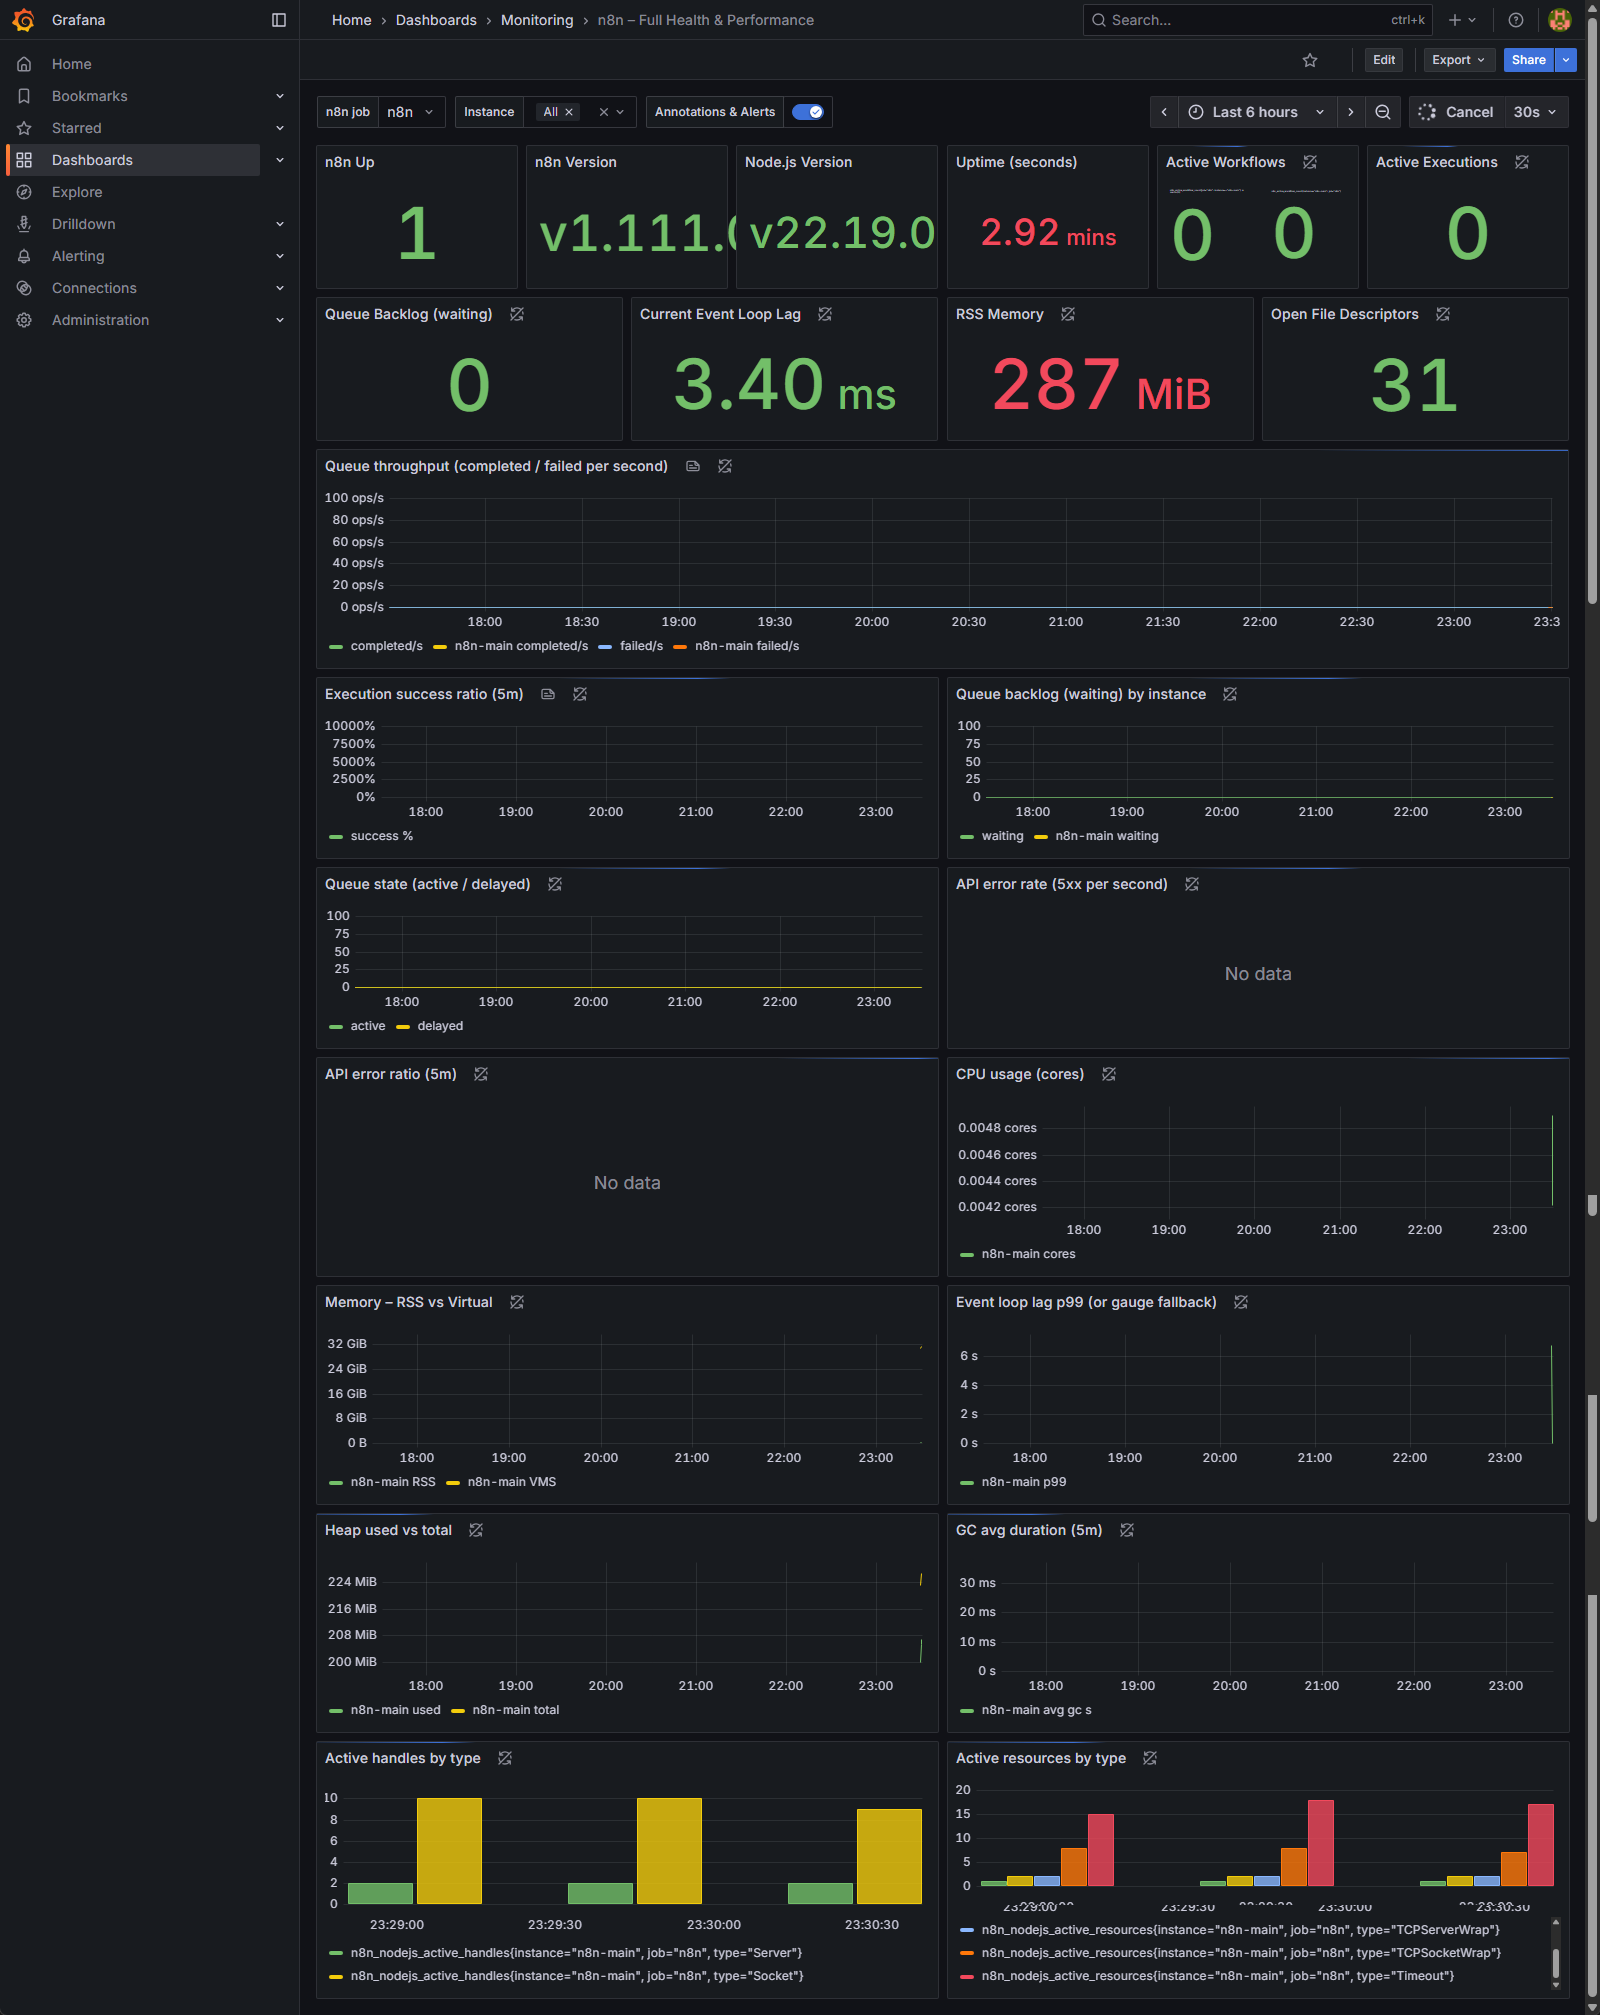
Question 1: Is my system healthy right now?
For a quick, at-a-glance status check, look at the large numbers (called “Stat Panels”) at the very top.
- Panels to Watch: n8n Up, Active Workflows, Active Executions, Queue Backlog (waiting)
- What to Look For:
- n8n Up should be 1. If it’s 0, it means Grafana can’t reach your n8n instance, and your monitoring is down.
- Active Workflows / Executions show you what’s running at this exact moment. These numbers will fluctuate, but they’re useful for seeing if the system is busy or idle.
- Queue Backlog (waiting): This metric specifically reports the number of workflow executions currently enqueued and awaiting processing by n8n workers.
- A value of 0 indicates that all incoming workflow triggers are being processed immediately by available workers, reflecting optimal system throughput.
- A temporarily elevated value during periods of high load is expected and acceptable, provided it rapidly decreases back to zero as workers catch up.
- A constantly increasing or persistently high value that does not return to zero is a critical indicator of resource saturation. This signifies that the rate of incoming workflow triggers exceeds the processing capacity of your n8n worker fleet, leading to execution delays. Remedial actions would typically involve scaling out your n8n workers or investigating potential bottlenecks in current workflow executions.
Question 2: Is my server keeping up with the workload?
This question is about performance and stability under pressure. If your system is falling behind, these panels will show the strain.
- Panels to Watch: Current Event Loop Lag and Queue throughput (completed / failed per second)
- What to Look For:
- Current Event Loop Lag: This measures the delay in n8n’s core processing engine. A low number (like the 3.40 ms in the image) is excellent. If this number starts climbing into the hundreds of milliseconds or multiple seconds, your instance is overloaded.
- Queue throughput: This graph shows how many workflows are being processed. The green line (completed/s) is what you want to see. The crucial thing to watch for is the blue line (failed/s). Any sustained presence of failures on this graph means you have a recurring problem that needs immediate investigation.
Question 3: Is my n8n instance running out of resources?
Even if workflows are completing, you could be heading for a crash if you’re running out of server resources.
- Panels to Watch: RSS Memory and CPU usage (cores)
- What to Look For:
- RSS Memory: This shows how much RAM your n8n instance is actively using (287 MiB in the image). Watch for a trend of this number constantly increasing over hours or days without ever coming down. That’s a classic sign of a “memory leak” in a workflow and will eventually crash your server.
- CPU usage: This graph shows how much processing power n8n is using. Spikes are normal when workflows are running, but if the usage is consistently high (e.g., pinned at 80-100%), your server is undersized for its workload, and performance will suffer.
By regularly checking these key panels, you can move from guessing to knowing exactly how your n8n instance is performing. While the other graphs on the dashboard are useful for deep-dive diagnostics, these three questions will give you 90% of what you need to ensure your automation platform is stable, healthy, and reliable.
Monitoring the Foundation: Your Server Health Dashboard (Node Exporter)
While the n8n dashboard shows you the health of the application, this “Node Exporter” dashboard shows you the health of the server it runs on—the underlying Ubuntu VPS. It’s your window into the machine’s core resources: CPU, memory, disk space, and network activity.
Its most critical function is to help you answer one question immediately: “Is my problem caused by the n8n application, or is the server itself struggling?”
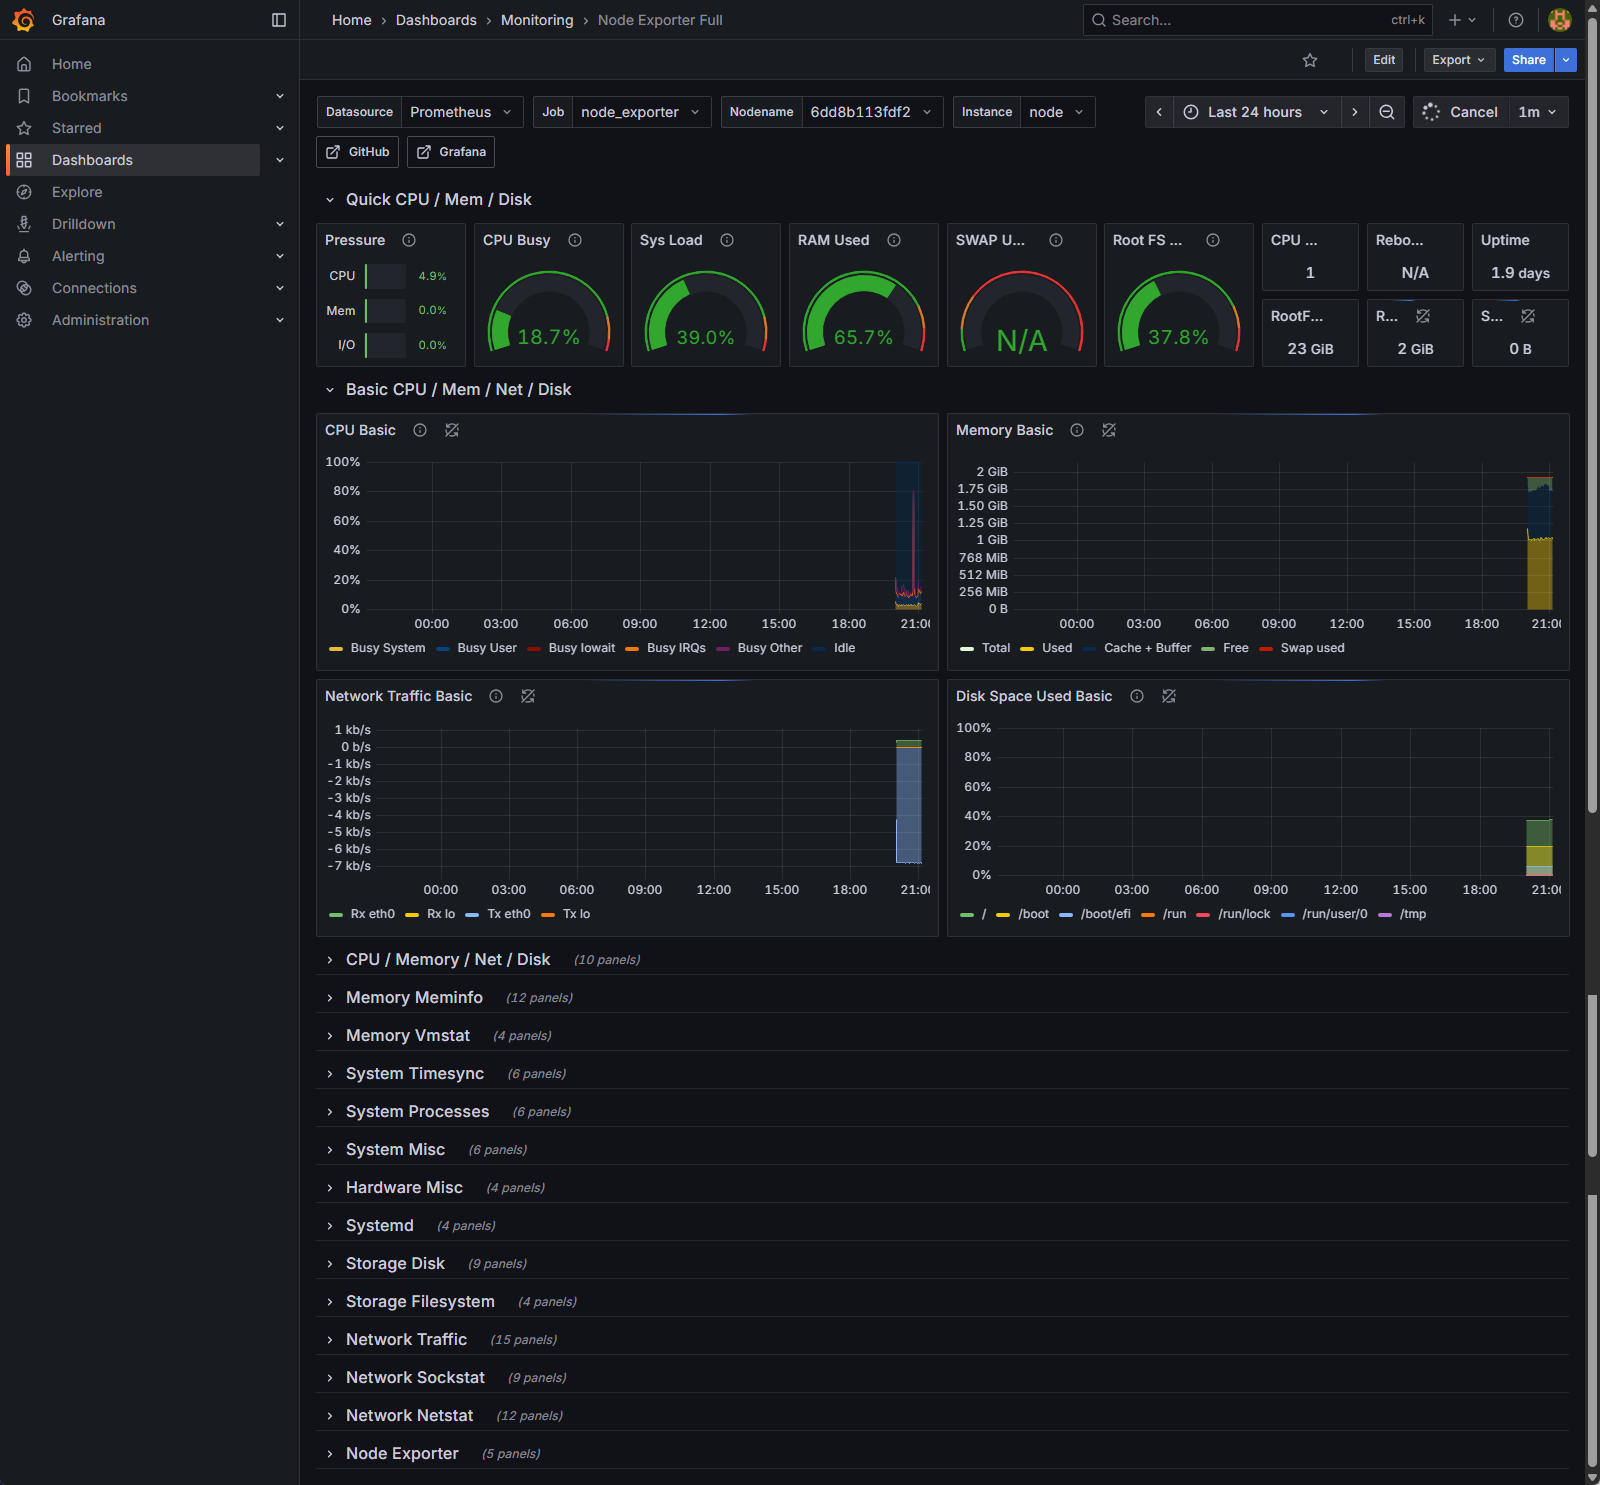
How to Read It in 30 Seconds
For a rapid diagnosis, focus on the row of large gauges at the top of the dashboard. This is your “Quick CPU / Mem / Disk” overview.
- Is the CPU overloaded? (CPU Busy & Sys Load)
- The CPU Busy gauge shows the current processor utilization. Spikes are normal when workflows run, but if this gauge is sustained above 75-80%, your server is CPU-bound, and all applications on it will slow down.
- Sys Load reflects the number of processes waiting for CPU time. If this number is consistently higher than your number of CPU cores, it confirms the processor is a bottleneck.
- Is the server out of memory? (RAM Used & SWAP Used)
- The RAM Used gauge shows how much physical memory is in use. High usage (like the 65.7% shown) is often fine, as modern operating systems try to use available RAM efficiently.
- The SWAP Used gauge is the critical one. Swap is a slow, emergency memory on your hard disk. If this gauge shows anything other than 0% or N/A, your server has run out of fast RAM and is under severe memory pressure. Performance will be drastically degraded.
- Are you running out of disk space? (Root FS Used)
- This gauge shows the disk usage for your main partition. As a rule of thumb, if this value exceeds 80%, it’s time to either clean up old files and logs or provision a larger disk. A full disk can crash your entire server.
The Triage Rule: Finding the Root Cause
When you have an issue, use this simple decision-making process to find the source of the problem.
- Scenario 1: This Node Exporter dashboard is GREEN, but your n8n dashboard is RED.
- Diagnosis: The server infrastructure is healthy. The problem lies within the n8n application stack.
- Next Steps: Don’t change the server. Instead, investigate the n8n execution logs for workflow errors, check the n8n Grafana dashboard for high application-level memory usage, or look for slow queries in your PostgreSQL database.
- Scenario 2: This Node Exporter dashboard is RED (high CPU, swap is in use, or disk is full).
- Diagnosis: The server itself is the bottleneck. The errors you see in n8n are likely a symptom of this underlying infrastructure pressure.
- Next Steps: Your priority is to fix the host machine first. Scaling your application won’t help if the foundation is unstable. You need to add more vCPU or RAM, increase disk space, or migrate to a more powerful server.
Drilling Deeper: Container Health with the cAdvisor Dashboard
The Node Exporter dashboard tells you if the server is under stress. The cAdvisor (Container Advisor) dashboard tells you why. It provides real-time telemetry for every individual container running on your host, allowing you to pinpoint exactly which service is the resource bottleneck.
When the Node Exporter shows a problem, this is your next stop for diagnostics. It answers the critical question: “My server is under pressure, but which container is causing it?”

How to Read It Fast
This dashboard breaks down resource usage by container name, letting you compare them side-by-side.
- CPU Usage (Per Container)
- What it is: The top graph shows CPU utilization for each container. It’s the best way to spot a “noisy neighbor”—a single service consuming a disproportionate amount of processing power.
- How to read it: Look for the line that is consistently higher than the others. In the example image, the n8n-main-1 and n8n-grafana-1 containers are the most active. If the entire server’s CPU is high, this graph will immediately show you which container is the primary contributor.
- Memory Usage (Per Container)
- What it is: This is arguably the most important section. It shows the exact RAM footprint of each container.
- How to read it: When your server’s memory is high, find the container with the highest line on this graph. The table to the right provides precise Mean and Max usage stats. A sustained, creeping growth in the n8n-main-1 line that never goes down is a classic sign of a workflow memory leak or a problem with oversized data payloads being processed.
- Network Traffic (Received/Sent)
- What it is: These graphs show the network I/O for each container.
- How to read it: Use this to identify unexpectedly “chatty” services. Is a container sending or receiving far more data than you expect? This could point to an inefficient process or a service stuck in a failing retry loop, constantly making network requests.
- Containers Info Table
- What it is: This table at the bottom is a quick-reference manifest of your running services.
- How to read it: Use this to quickly verify critical information. Check the Registry Image column to confirm the correct version of each service is deployed. Look at the Running column for uptime. A container with a very short uptime (e.g., a few seconds) might be stuck in a crash loop, indicating a startup configuration error.
Monitoring the Front Door: Your Traefik Health Dashboard
Traefik is the reverse proxy for your entire stack—it’s the secure front door that routes all incoming user traffic to the correct application, whether it’s n8n or Grafana. This dashboard is your first point of diagnosis for any connection-related issue.
It answers the most fundamental question when something goes wrong: “Is the problem happening before the request even reaches my application?”
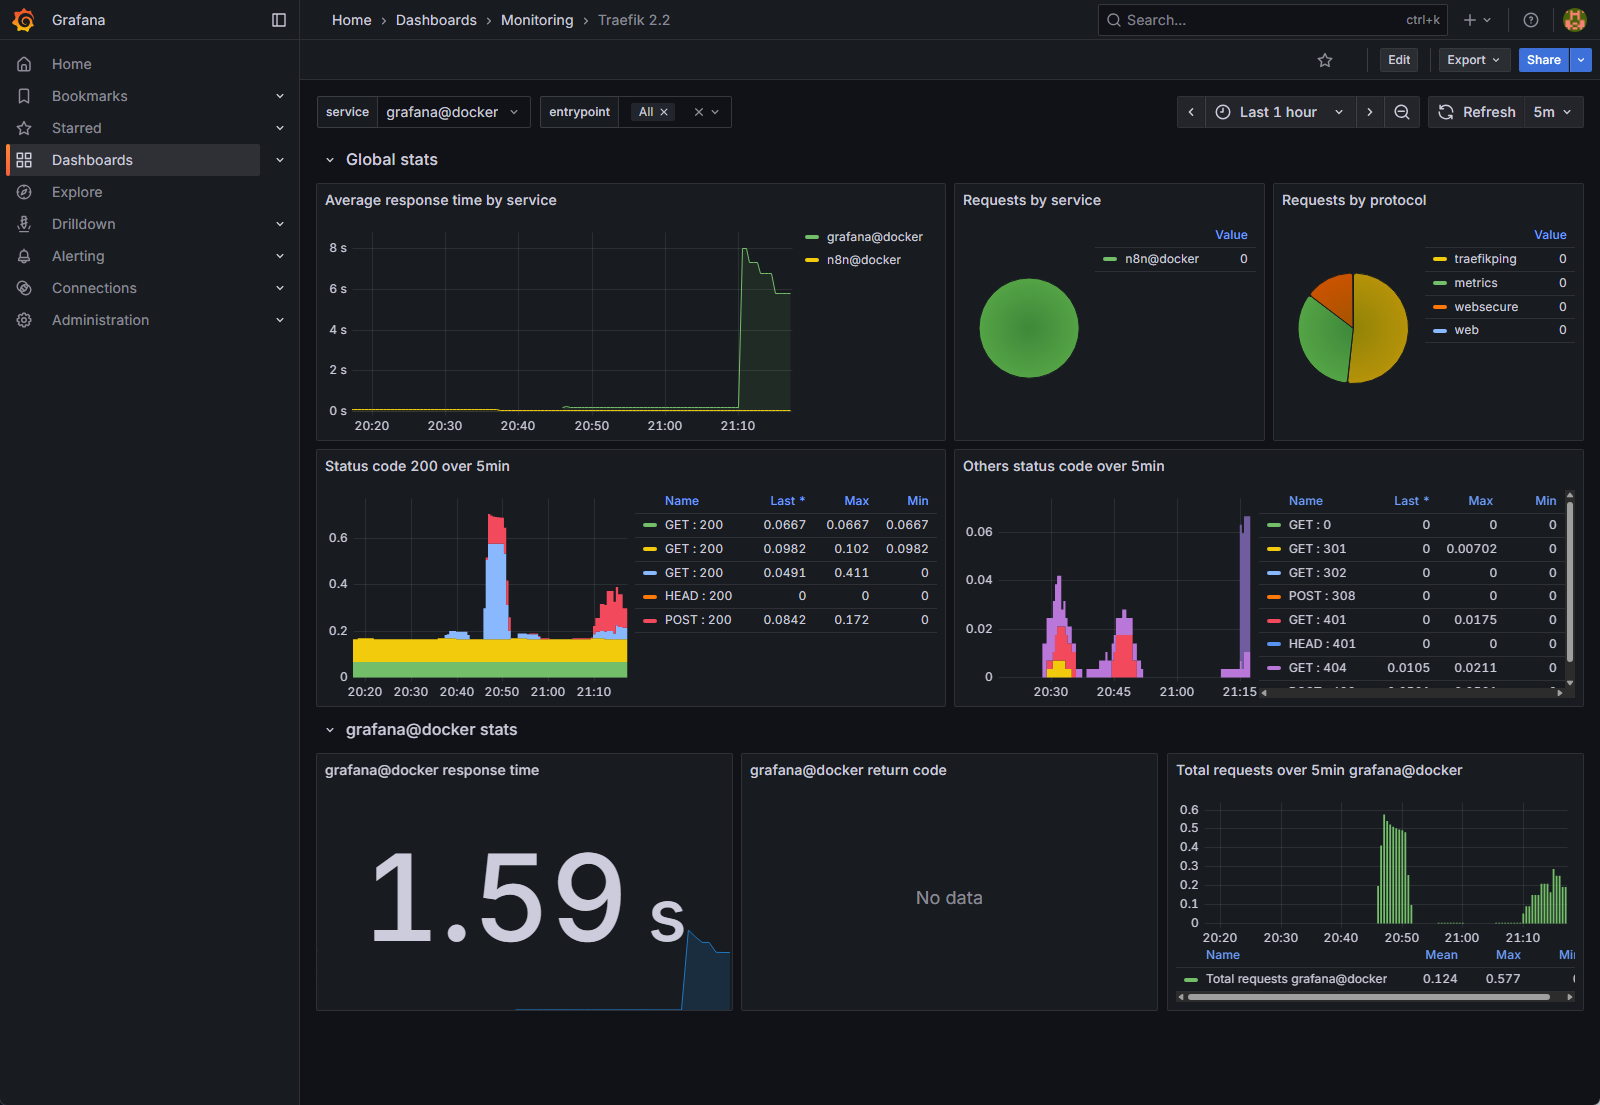
How to Read It Fast: A Triage Guide
When users report issues, this dashboard provides a high-level view of traffic health. Focus on these key areas to quickly determine the nature of the problem.
- Are my applications slow or unresponsive? (Average response time by service)
- What it is: This graph shows the end-to-end latency for requests passing through Traefik to your backend services. In simple terms, it’s how long users are waiting for a response.
- How to read it: Spikes in this graph, like the one for grafana@docker around 21:10 in the image, indicate that a service is taking a long time to process requests. If this line is consistently high for n8n@docker, it means your n8n instance itself is slow, even if it’s not completely failing.
- Are my applications returning errors? (Status codes over 5min)
- What it is: These two panels are the most critical for error diagnosis. They show the HTTP status codes Traefik is receiving from your applications. The left panel shows successful 200 OK codes, while the right panel (Others status code) shows everything else—redirects, client errors, and server errors.
- How to read it:
- A lot of green (2xx codes): Everything is healthy.
- A spike in 4xx codes (e.g., 401, 404): This indicates client-side errors. A user might be trying to access a page that doesn’t exist or using incorrect credentials. This is usually not a server crisis, but could point to a broken link.
- Any spike in 5xx codes (e.g., 500, 502): This is a critical alert. A 5xx error means your application (like n8n) has crashed or is failing internally. Traefik is working, but the service it’s trying to route to is broken.
- Where is my traffic going? (Requests by service)
- What it is: The pie charts provide a simple breakdown of how many requests are going to each service (n8n@docker, grafana@docker, etc.) and through which entry points (websecure for HTTPS, web for HTTP).
- How to read it: This is useful for understanding your workload. If you have a sudden performance issue, you can check this chart to see if one particular service is receiving an unusually high volume of traffic.
By combining these views, you can immediately determine if an issue is related to network latency, a failing application server, or a specific type of user error, allowing you to focus your investigation on the right part of the stack.
How Do You Set Up Automated Workflow Error Alerts to Go Proactive in n8n?
Dashboards are powerful, but you can’t stare at them all day. The ultimate goal of monitoring is to be notified automatically the moment a problem occurs. This section will guide you through setting up a comprehensive set of n8n workflow error alerts using Grafana’s built-in alerting engine. For a dedicated walkthrough of n8n’s native error-handling and Slack notification workflows—independent of Prometheus—see our guide on n8n workflow error alerts and silent failure prevention.
Instead of writing complex YAML files for Prometheus, we can define, manage, and import a full suite of alerts directly within Grafana. To give you a massive head start, we’ve compiled a production-ready “alert pack” based on the JSON provided. You can import this entire suite in minutes.
Let’s break down the most critical alerts included in this pack, categorized by what they protect you from.
Alert Category 1: Foundational Instance Health
These alerts apply to any n8n setup and monitor the fundamental health of the application and the resources it consumes.
- Alert Rule: n8n Down
- What it does: This is the most basic yet crucial check. It triggers if Prometheus can no longer reach your n8n instance’s metrics endpoint for more than two minutes.
- Why it’s critical: This tells you the entire n8n service is offline or has crashed. It’s your first line of defense.
- Alert Rule: Event loop lag p99 very high (critical)
- What it does: Triggers if the 99th percentile of event loop lag exceeds 500 milliseconds.
- Why it’s critical: This is a sophisticated way of saying “the n8n engine is severely overloaded.” It can’t process tasks as fast as they are coming in. This is a leading indicator of performance degradation and potential timeouts, even if the application hasn’t crashed yet.
- Alert Rule: RSS memory high
- What it does: Triggers if n8n’s resident memory usage stays above a set threshold (e.g., ~850 MiB in the example) for 10 minutes.
- Why it’s critical: This alert protects you from out-of-memory crashes. A sustained high memory usage points directly to a memory-intensive workflow (e.g., processing a large file) or a potential memory leak that needs immediate investigation.
Alert Category 2: Scalability & Throughput (Queue Mode)
These alerts are designed specifically for scalable n8n deployments that use a queue and dedicated workers.
- Alert Rule: Queue backlog high (critical)
- What it does: Fires when more than 100 workflow executions have been waiting in the queue for over 5 minutes.
- Why it’s critical: A persistent backlog means your trigger rate is overwhelming your worker capacity. Executions are being delayed, and you either need to add more n8n workers or investigate why your current workers are slow or stuck.
- Alert Rule: Queue throughput stalled (critical)
- What it does: An advanced check that triggers if there are active jobs in the queue, but the rate of completed or failed jobs is near zero.
- Why it’s critical: This detects a dangerous “stuck” state where your workers are running but are not actually processing any workflows. This could indicate a problem with your queue (Redis) or a systemic issue causing all workers to hang.
How to Implement Your Alert Pack
You can download the complete JSON file containing all these rules and more. This file is a template that you can import directly into Grafana to get a complete alerting setup instantly.
- In your Grafana instance, navigate to the Alerting section in the left-hand menu.
- Click on Alert rules and then click the Import button.
- Upload the provided JSON file. Grafana will automatically load all the groups and rules.
Consultative Note: This alert pack provides an expertly configured starting point. However, the ideal thresholds—especially for memory and CPU usage—will vary depending on your server’s resources and your specific workload. Fine-tuning these values to eliminate noise while ensuring you never miss a critical failure is an ongoing process. If you prefer a hands-off approach with alerts that are pre-tuned and managed for you, feel free to contact us to learn about our managed n8n solutions.
FAQ: n8n Monitoring & Error Handling
Question 1: Can I monitor n8n without Docker?
Answer: Yes, the principles are the same. This guide uses Docker for simplicity, but you can achieve the same `n8n self-hosted monitoring` setup by installing Prometheus and Grafana natively on your server. You would need to configure the `n8n.env` file to enable metrics (`N8N_METRICS=true`) on a specific port, then point your Prometheus configuration to that server address and port for scraping.
Question 2: How can I monitor the performance of a single node within a complex workflow?
Answer: While n8n’s built-in metrics are instance-level, you can gain node-level insight by creating “Error” workflows. Configure critical nodes with the “Continue on Fail” setting enabled, and connect their failure output to a webhook trigger in a separate logging workflow. This allows you to log granular details about the failure or send custom `n8n workflow error alerts` for specific nodes, giving you more control.
Question 3: What are the most common causes of high memory usage in n8n?
Answer: The most common causes of high memory usage include processing large binary files (like images or PDFs) directly in workflows, inefficiently looping over thousands of items without proper batching, and keeping very large datasets in memory between nodes. Implementing `n8n memory usage monitoring` with the Grafana dashboard in this guide is the first and most critical step to identifying which workflows are responsible for memory spikes.
Resources
- Prometheus config on n8n: https://docs.n8n.io/hosting/configuration/configuration-methods/
- n8n-observability: https://github.com/thenguyenvn90/n8n-observability/
- Dealing with errors in workflows | n8n Docs
- Monitoring | n8n Docs
- Enable Prometheus metrics | n8n Docs
Conclusion
You’ve gone on a journey from reactively checking execution logs to building a comprehensive, production-grade monitoring system for your self-hosted n8n instance. You now have the tools to visualize performance with Grafana, anticipate resource issues by monitoring memory and event loop lag, and receive proactive alerts for workflow failures using Prometheus Alertmanager.
A robust monitoring strategy is the difference between a hobby project and a reliable, business-critical automation platform. By implementing this playbook, you’ve laid the foundation for operational excellence, ensuring your automations are not just powerful, but also dependable.
Feeling overwhelmed by the complexity of managing and monitoring a production n8n environment? Explore our Managed n8n Platform and let our experts handle the infrastructure, so you can focus on building workflows.